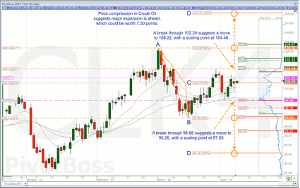
Crude oil’s price range has compressed significantly in recent trading, suggesting range expansion is ahead, which could offer a move worth 7.50 points in the next two weeks, says Frank Ochoa of PivotBoss.com.
On March 25, I wrote: “the bears are currently in control, and are defending the rips with each new lower high. Of course, that doesn’t mean the battle is over. If the bulls can reclaim 100.32 and gain acceptance above this level, we could see a swift short covering rally that could lift price into prior value at 101.44, with a shot to rally to the top of value at 102.24.”
Buyers were able to overtake the 100.32 key level in crude oil, which triggered the upside buy stops of the sellers that had been absorbing demand for four consecutive sessions. The result was a swift rally into value at 101.44 in one session, followed by a continuation to the final target at 102.24 the next session, which became the exact high of the move.
Clearly the market rejected the 102.24 key level on first touch, sparking an even greater sell-off back to value at 98.88, which was strongly bid, offering another buying opportunity back to 101.44.
Clearly, crude oil has demonstrated a propensity to react to our key levels over the recent months, which has helped us identify great swings along the way. A new harmonic pattern has now emerged in crude, which could provide the next 7.50 point move over the next two weeks.
The daily chart of crude oil shows a new harmonic pattern has emerged, which provides us a potential blueprint for where price could be headed down the road, in addition to providing key levels and targets for both the bull and bear cases.
The A point of the harmonic triangle is 104.48 and the B point is 97.00, both of which are key levels. The C point is the center of the pattern at 100.74, also known as the pivot. The distance between the A and B points is 7.48, which means that once price breaks free from balance we could see a move away from the C point that is equal to the AB distance of 7.48 points.
Having mentioned that, the upside D point is 108.22, which is the 100% projection of the AB distance from the C point of the pattern, and will be used as the bull target in the case of a short squeeze through the 102.24 key level. The downside D point is 93.26, which is also the 100% projection from the center of the pattern at point C, and will be the bear target should value go offered at 98.88.
Crude oil has trended higher for much of the year, so the primary expectation is for price to break through the 102.24 key level and rally to 104.48 (scaling target), followed by a secondary move to the primary upside objective at 108.22, which is the upside D point of the harmonic pattern.
The bear case will arise if value goes offered at 98.88, which would be significant in and of itself. Buyers have kept the 98.88 level bid in recent weeks, so running the downside sell stops below this level will likely trigger a move into the B point of the pattern at 97.00 (scaling target), followed by a secondary push to the primary downside objective at 93.26, which is the downside D point of the harmonic pattern.
Further trading range activity could be seen between 98.88 and 102.24 before expansion occurs. But once the stops are run, look for a swift move in the direction of the break, as the first round of stops are released. Once the breakout occurs, the D point objective is likely to be reached within two to three weeks.
By Frank Ochoa of PivotBoss.com


