Given the 2015 high volatility sell-swing in the US stock market, Corey Rosenbloom, of AfraidToTrade.com, updates his Keltner Channel indicator analysis, outlines how these channels can be helpful spots for traders looking to initiate new trades, and pinpoints levels currently in play.
After the 2015 high volatility sell-swing in the US stock market, all indicators have been affected by the sell-off.
Let’s update our Color Keltner Channel Indicator and pinpoint what’s happened and what levels are in play now.
Keltner Channels—or Keltner Bands—are similar to Bollinger Bands in that they wrap around price while expanding and contracting with volatility.
The major difference is that Bollinger Bands use a standard deviation function while Keltner Channels use an Average True Range (ATR) function for calculation.
Some traders prefer Keltner Channels because they appear more stable and less wavy than Bollinger Bands.
Nevertheless, Keltner Bands plot an average (the midpoint) and a lower and upper band away from the average.
Again, Keltner Channels tend to remain stable except in periods of extreme volatility, like that of October 2014 and now August 2015.
Like Bollinger Bands, traders can expect price eventually to move from the lower band back to the upper band and bounce between the indicator levels.
Once again, in periods of high volatility, price can Ride the Keltners, which means closing multiple sessions outside the bands (reference October 2014 again along with the sell-swing in August 2015).
Ok, now on to the key levels.
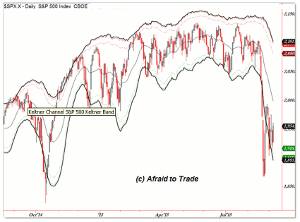
For the S&P 500, the Midpoint (Magnet) exists near 2,000.
The Lower Keltner Channel—extending lower—exists just under 1,900 (1,895 to be exact).
Finally, the Upper Keltner Channel reflects the Midpoint of the prior trading range near 2,100.
During a trading range—or consolidation—Keltner Channels can be helpful targets (to play a swing toward the Bands) and spots to initiate new trades.
During high volatility environments, that logic is tossed out the window as price breaks through, and closes outside the Bands.
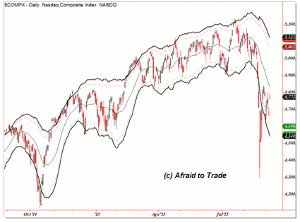
Here are the short-term levels in the NASDAQ Index (and how volatility affects the bands):
The Upper Band rests at 5,125, the Lower Band is 4,540, and the Midpoint is 4,772.
Those numbers aren’t as clean as the S&P 500 levels, but nevertheless, they can provide guideposts now.
Note the up/down ping-pong price movement on the chart, especially through consolidations and compare the recent volatile swing with that of October 2014 and even big swings from May 2010 and August 2011 for additional trading insights.
By Corey Rosenbloom, CMT, Trader and Blogger, AfraidToTrade.com


