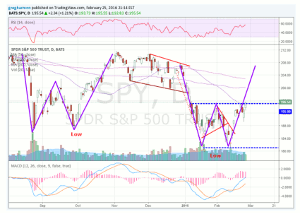
Although 2016 has, so far, been a horrible year for stocks, Greg Harmon of Dragonfly Capital uses technical analysis to indicate that—with only two days left to go in February, as of last Friday—the markets have pulled out of a double bottom and are cracking that early January resistance.
2016 has been a horrible year for stocks over the first two months. Equities are off too much, oil keeps falling, and bond yields are crashing. This has been the worst start to a year ever for stocks. It seemed like there might be a reversal back at the end of January but that petered out. But with just two days left to go in February, the markets have pulled out of a double bottom and are cracking that early January resistance.
The chart below is giving four signs that the latest leg higher in the S&P 500 (SPX) (SPY) may have a lot of room left to run. The first is the break of that dotted resistance line Thursday. This is a key to another sign, the W. You can see how the last W played out from August to November. This one is tighter and looks to play out to about 207.50 over the next two weeks.
The move Thursday also brought the SPY over its 20-day SMA for the first time this year. To read the entire article, click here...
By Greg Harmon of Dragonfly Capital


