You must respect the fact that this is a bull market. Therefore, downside set ups are not for aggressively shorting for most people, rather, are times to consider where and what you want to be buying on the dip, asserts Avi Gilburt, a widely-followed Elliott Wave technical analyst.
One of the benefits of being a part of a trading room with over 3000 members, over 400 professionals, and 15 analysts is that we all can take advantage of the combined wisdom of all the members and analysts in the room. Since I am but one person within this room, I am clearly unable to see all potentials the market may be throwing at us. And, thanks to the collective wisdom of the room, several people have provided me with insights today (May 23) which I did not have on my own. So, there is no question that we all can benefit from the collective wisdom of the room, and for that I am grateful to you all.
First, Garrett private-messaged me today to tell me that he is having a hard time seeing enough stocks setting up to support a rally to S&P 500 Index (SPX) 2500SPX at this time. Rather, many of them still need more pullback before they can substantiate such a run. And, since this is a market of stocks, I clearly need to take that into account in my own analysis.
Second, I have noted several times that I really do not like the high that I considered the top to the (b) wave before, because the rally into that high really counted best as a 3-wave move. Since that time, I have been struggling to understand how I can reconcile that issue with the overall market action. Well, today, Bill Adlard, one of our members and a highly acclaimed analyst in his own right, presented a count on the board which gave me insight into a truly elegant solution to the issues I was having, and I have modified the count on my chart to take advantage of his insight.
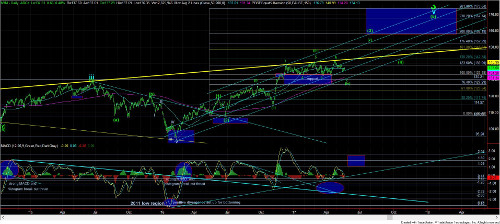
If you look at my 60-minute chart, you will see that we can count this seemingly 5 wave rally as a (c) wave within the b-wave still. In fact, whereas the larger (b) wave of the b-wave would have taken the great majority of the time during this corrective move, the (a) wave and (c) would now be almost equal in time, as well as in size.
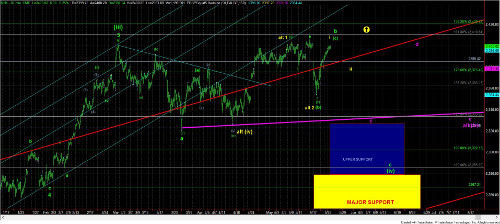
Based upon this modified count, I am still in the camp of seeing much further downside in the coming weeks, and this count can still support a strong c-wave down to the 2285-2330SPX region. Moreover, as I have noted before, the iShares Russell 2000 Index ETF (IWM) provides more evidence that the downside has potentially not yet completed.
However, I will note that should the next drop below 2385SPX be corrective in nature, and then we rally through the high we make in this rally, I will likely move into the alternative count in yellow, which points us to the 2500SPX region sooner than I had preferred. The reason I say we have to break 2385SPX is because that is the .382 retracement of what can be a 3rd wave top at today’s highs, so I would first want to see the market break below that region to suggest we still do not see a 4-5 to complete a bigger (c) wave up here, which can then take us until the end of this week.
So, for now, I am still looking for a bigger downside reaction in this larger 4th wave. However, as I have stated many times before, you must respect the fact that this is a bull market. Therefore, downside set ups are not for aggressively shorting for most people–at least in my humble opinion–but, rather, are times to consider where and what you want to be buying on the dip.
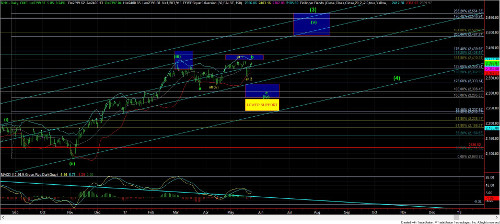
Remember, the strongest likelihood and highest probability perspective we see on these charts right now is the rally to the 2500SPX region. But, what we still struggle with is from where we begin that rally. And, as I have noted many times before, knowing where a 4th wave has completed when it is not a textbook 4th wave is often one of the hardest things we do when it comes to Elliott Wave analysis.
See larger charts illustrating the wave counts on the S&P 500 here.
Subscribe to Elliott Wave Trader here...