

The odds of a “trend reversal” on the charts are small without those charts first transitioning into trading ranges. There is only a 20% risk of a trend reversal. Traders will buy any selloff, which will be a pullback and not a trend reversal, asserts Al Brooks.
Monthly S&P500 Emini futures candlestick chart:
Blow-off top
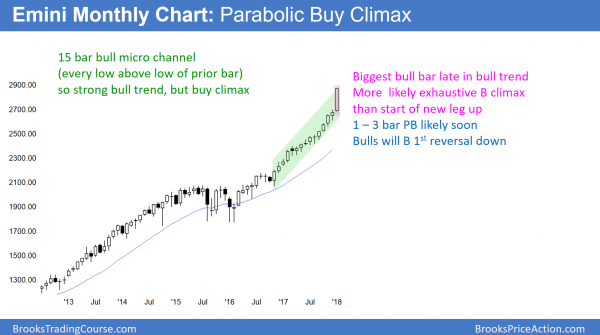
The monthly S&P500 Emini futures candlestick chart has the biggest bull trend bar in more than 20 bars so far this month. In addition, there has been no pullback below a prior month’s low in 14 months.
The monthly S&P500 Emini futures candlestick chart is in a strong bull trend. This month’s low is above last month’s low. In addition, the low of every month for the past 14 months is above the low of the prior month. Hence this is a 15 bar bull micro channel. It is a sign of very confident bulls, but it is now extreme.
The longest prior micro channel in the history of the S&P 500 Index (SPX) was 13 months, in 1995. The odds are against this streak lasting much longer. However, since the bulls have been so eager to buy above the prior month’s low, they will be happy to buy below the prior month’s low once they get the opportunity.
Typically, the bulls will immediately buy below the low of a bar in a micro channel that lasts 5 – 10 bars. But, when one lasts longer, traders know that the risk of a violent pullback is greater.
Consequently, they will hesitate, waiting to be sure that the pullback will not be a fast, deep, climatic reversal. As a result, they often wait 2 – 3 bars (here, months).
nce they are confident that the pullback will not fall far and fast, they buy again. Since this bull trend is exceptionally strong, the odds are that the pullback will lead to a new all-time high within a few months.
Weekly S&P500 Emini futures candlestick chart:
Exhaustive buy climax
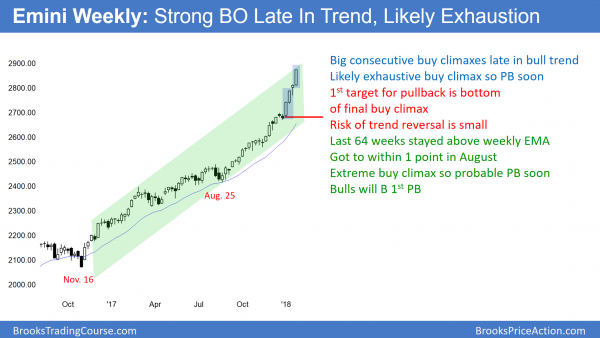
The weekly S&P500 Emini futures candlestick chart got to within a point of the 20-week exponential moving average in August. However, it has not touched the EMA in 64 weeks. The consecutive big bull trend bars in early January will probably be the start of an exhaustive buy climax.
The weekly S&P500 Emini futures candlestick chart has never gone 64 weeks without touching its 20-week exponential moving average. In fact, the cash index has never had a streak that long in its 95-year history. Furthermore, the weekly Dow Jones Industrial Index (DJI) has never had a comparable streak in its 122-year history. While this streak can continue forever, it will not.
In addition, since it is much longer than any prior streak, the odds are that the weekly chart will begin to turn down within the next few weeks. Since it is so far above its average price, it might take 5 or more weeks to get down to the 20-week EMA.
Because the bull channel is so tight, there is only a 20% chance of an immediate reversal into a bear trend. The pullback will probably be only about 5%. However, even if it is 10% and lasts several months, there is a 70% chance that it will lead to a new high within a few month of turning back up.
Daily S&P500 Emini futures candlestick chart:
Emini parabolic wedge buy climax ahead of Trump’s Mueller testimony
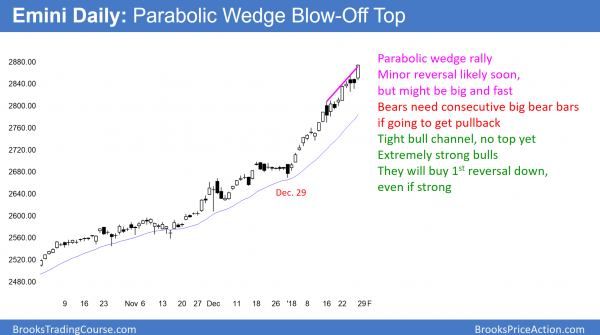
The daily S&P500 Emini futures candlestick chart rallied strongly in January in a series of 3 buy climaxes. Since the channel is tight, this is a parabolic wedge. The odds favor about 10 days of sideways to down trading.
The daily S&P500 Emini futures candlestick chart has gone 399 trading days without a 5% correction. In addition, it has not had a 3% correction in 451 calendar days and 304 trading days. All 3 streaks are the longest in the 20-year history of the Emini, the 95-year history of the S&P index, and the 122 years of the Dow Jones Industrial Index.
Markets reflect human behavior and therefore usually do not go far beyond what they have done in the past. This means that the odds favor a 5% pullback soon. However, because the weekly and monthly charts are so strongly bullish, any reversal will likely be a bull flag on those charts and not a bear trend. Yet, if the selloff lasts 3 months and falls 10%, the daily chart would probably be in a bear trend temporarily.
Parabolic wedge top
The Emini has been in a tight bull channel in January. In addition, the rally has had 3 surges. It is, therefore, a parabolic wedge. If the Emini begins to pull back next week, the high will be a parabolic wedge top.
Since the weekly and monthly charts are in tight bull channels, the bulls will quickly buy reversals. This even includes sharp reversals, like 5% in 3 days, if this were to happen.
Volatility index
The CBOE Volatility Index (VIX) has drifted up over the past 2 weeks while the Emini keeps making new highs. This increase in volatility might be a warning that the Emini will soon begin to have 2 – 5 % pullbacks within a month or two. Furthermore, it increases the chance of a 2 – 3 day 100 point selloff. This would still be a pullback in a bull trend and not a trend reversal. It is important to understand that the word “pullback” means that the bull trend is still intact. The odds are that any selloff will lead to a new high.
I have made the point many times that the odds of a “trend reversal” on the weekly and monthly charts are small without those charts first transitioning into trading ranges. A trend reversal means that the bull trend has ended and a bear trend has begun. There is only a 20% risk of a trend reversal on the weekly and monthly charts in the next several months. Traders will buy any selloff. Consequently, a selloff will be a pullback and not a trend reversal.
Watch Al Brooks discuss how to trade common patterns that form during the first hour in his talk at the recent TradersExpo Las Vegas here.
Traders can see the end of the day bar-by-bar price action report by signing up for free at BrooksPriceAction.com.


