

This week, I’m going to tackle a natural follow-up question to last week: What’s behind the carnage in bonds, and what does that mean for all your other investments? Like stocks, asks Mike Larson, senior analyst at Weiss Ratings.
Last week, I wrote about how so-called “safe” U.S. Treasuries and funds that invest in them are racking up double-digit losses this year.
Some pundits point to faster economic growth. Others talk about the threat of inflation, a threat that could intensify if tariffs become more widespread. Then there’s the fact the Federal Reserve is steadily and consistently raising interest rates, and that other central banks in the U.K., Canada, and elsewhere are doing the same.
But frankly, it all goes back to those deadly “Twin Ds” – Debts and Deficits! Our country has been borrowing too much for too long, and we have no reasonable path back to the budget surpluses of yesteryear. That is driving a massive build up of debt, a build up the likes of which the world has never seen.
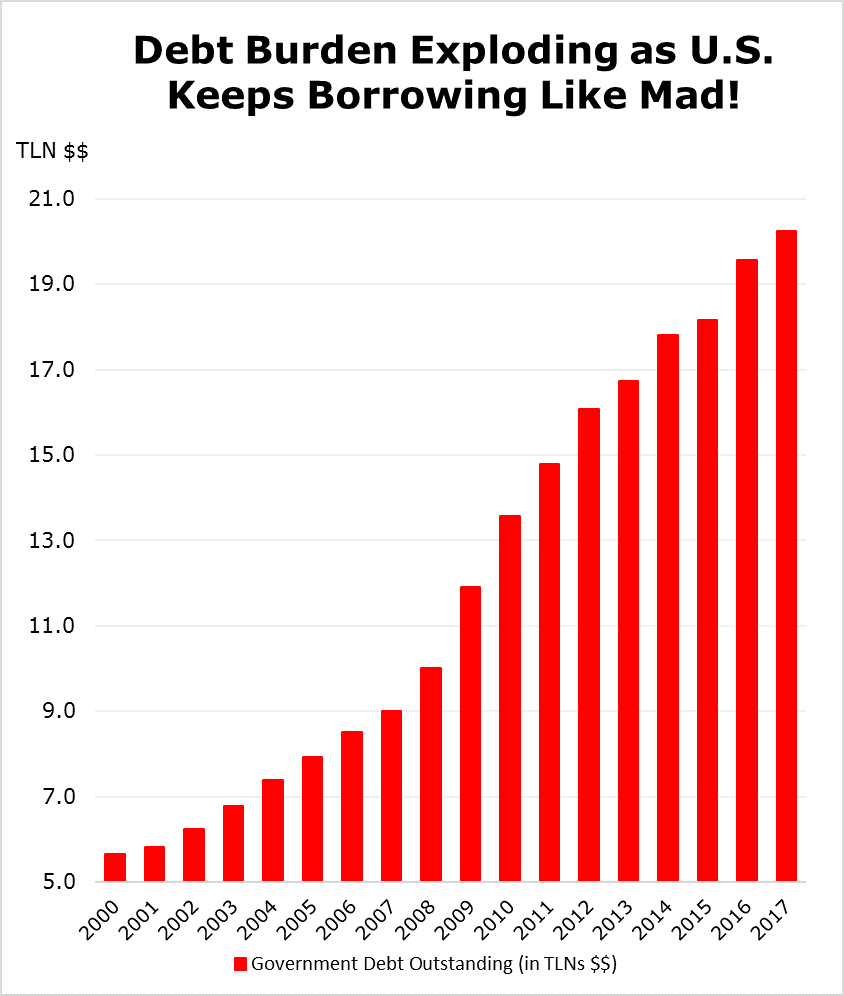
Take a look at this chart. It shows the level of federal government debt outstanding going back to the start of the millennium. You can see our debt burden has exploded more than 3.5X during that time -- to $20.2 trillion from $5.7 trillion.
It doesn’t matter if the president was a Democrat or Republican. It doesn’t matter if the economy was growing or shrinking. Nothing has stopped the relentless, extraordinary rise in government debt.
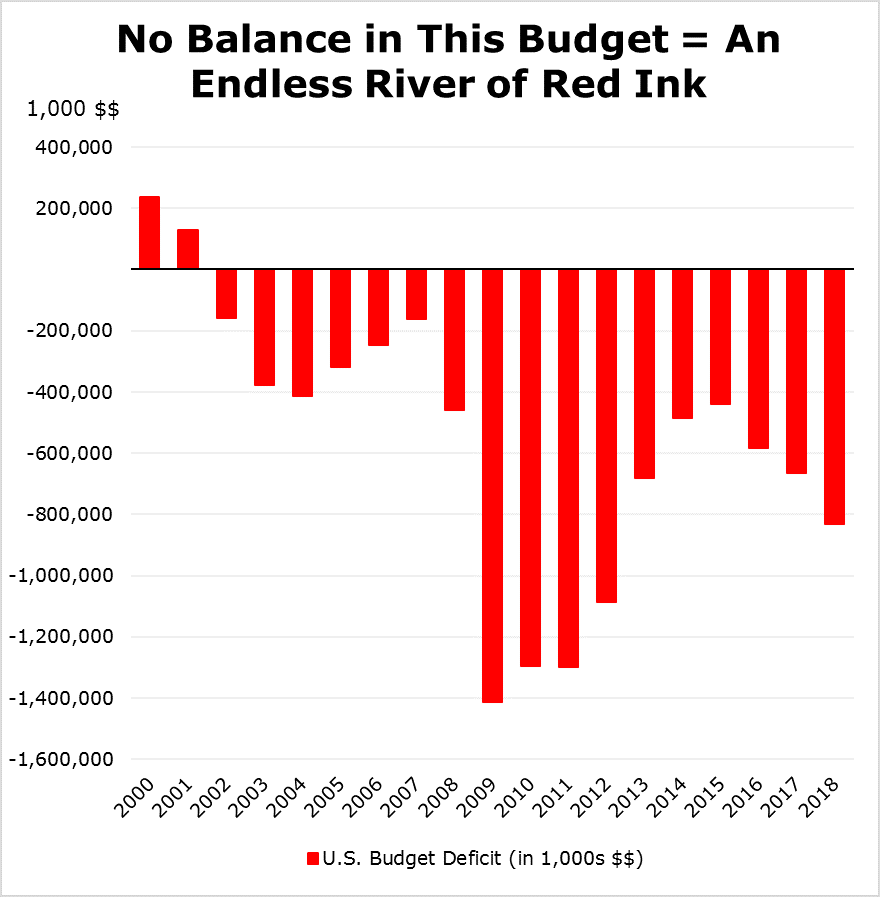
We’ve completely abandoned any idea of ever balancing the budget deficit, too. Just look at this chart and you’ll see we’ve had year after year of red ink – again, regardless of who was in the Oval Office or Congress.
And while the deficit did start to shrink from the all-time record of $1.4 trillion in 2009 to $438 billion in 2015, it’s growing once again. We’re on track to hit $832 billion in fiscal 2018, the most in several years.
Sadly, it’s not just Uncle Sam who’s gorging on debt. Corporate America is borrowing like crazy, too. Take a look at this chart, which shows the total amount of non-financial corporate debt outstanding in the U.S.
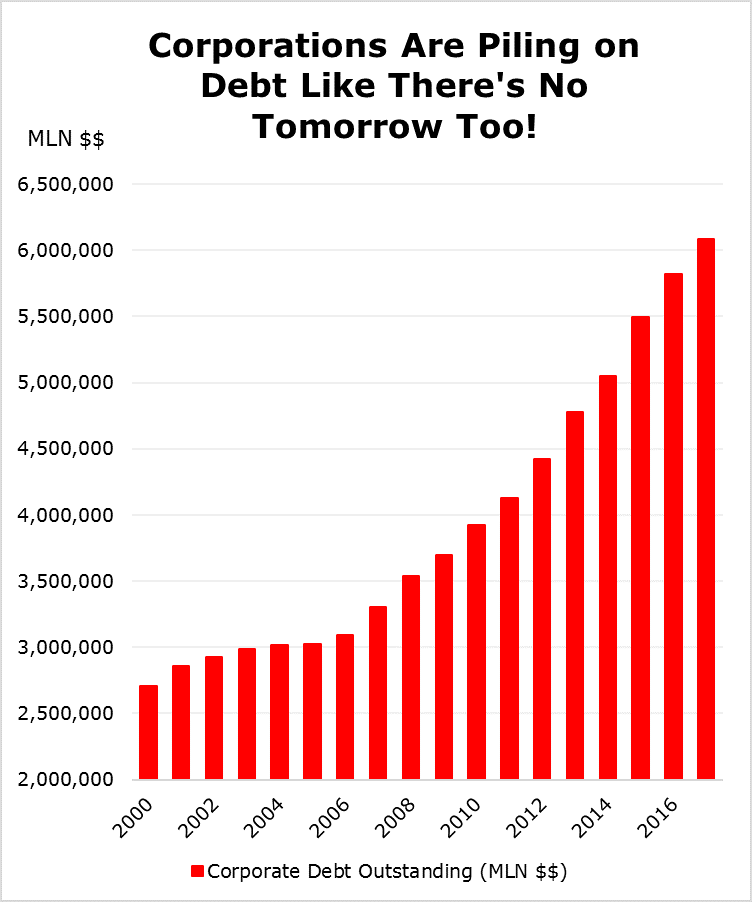
You can see that the level of indebtedness held fairly steady in the early 2000s, but has since ballooned. The tally rose to $6.09 trillion in late 2017 from $3.31 trillion a decade earlier – a stunning 84% surge!
For years, central banks the world over enabled and encouraged this kind of reckless behavior. They kept interest rates pegged near zero percent and pledged to buy trillions of dollars’ worth of government, mortgage, and corporate bonds. That helped artificially suppress interest rates and artificially inflate bond prices.
But those days are over now. Central banks are backtracking furiously on those policies. That combination of a massive rise in debt supply and a decline in debt demand is causing bond prices to fall. Since interest rates move in the opposite direction of bond prices, they’re going up ... and so are losses for bond investors!
So, what about stocks? Are they headed into the woodchipper just like bonds? I’ve been doing an awful lot of research and work on that topic, research that’s even more urgent now given what we’ve seen happen in the equity market so far in 2018.
I’m planning on sharing some surprising ... some might even say shocking ... conclusions with my subscribers soon. But suffice it to say my thinking is evolving fast based on what I’m seeing, and that the news isn’t good. After riding the coattails of the bull market for several years, I’m getting ready to pull in my horns – big time!
Until next time,
Mike Larson
Mike Larson is presenting at The MoneyShow Las Vegas May 16: Top Stocks to Buy During a Mid-Term Election Year. And: Investors Are Doing Everything Wrong (But There’s Still Time for You to Get Things Right!)
Check out Mike’s short video interview at MoneyShow Orlando: How to Find Dividend Stocks here.
Duration: 2:26
Recorded: Feb. 9, 2018.
Follow Mike Larson and subscribe to Weiss Ratings products here.


