

Successful traders are risk managers. Staying out of the way is the best strategy: having high levels of cash, trading small, and a short time frame are key to surviving this bear raid. Pat Travers, thanks for inspiring today’s column, asserts Joe Duarte, MD.
Anyone who’s a fan of classic rock or bar bands who specialize in the genre will recognize the two anthems for which the still active blues rocker Pat Travers is best known: “Boom, Boom, out go the Lights” and “Crash and Burn.” These two songs are the essence of the blues featuring tales of lost love, infidelity and self-inflicted personal struggles intermingled with searing guitar riffs. And, in timely fashion given the recent action in stocks, they seem to be as good a description of the moment and potential direction of Wall Street as any price chart.
Moreover, these songs may become especially personal to investors, who bought the recent dip and perhaps even the subsequent price top as they inspect their quarterly mutual fund and brokerage account statements in about a week’s time.
As a result, I would like to salute Pat Travers for his inspiration for this column and if he’s reading it, I’d like for the prescient Mr. Travers to drop me an e-mail and tell me the titles of any new song he’s working on, just in case I should be even more cautious of the market.
Last week, in this space while alluding to the FOMC meeting and the political situation in Washington DC among other things, I noted: “There is an old saying on Wall Street; beware the ides of March. Of course, that’s a reference to the fatal stabbing of Julius Caesar by his senate “buddies” in 44 B.C. and its aftermath. Indeed, there have been some dramatic events in the market and history in previous Marches. And while the ides, March 15, have already passed, there is a certain feeling in the air that the influence of this historical date isn’t quite done with 2018.” Traders: Time for short-term positions, take profits, keep cash.
I guess the ides of March did get an extension this year. So, the real question after a 1400-point drop in the Dow Jones Industrial Average (DJI) over a few days is: whether this is the proverbial panic bottom and swift turn around? Or whether this is the beginning of the highly predicted but yet fully arrived bear market pranced out regularly in reports and predictions by the perma-bears?
Market breadth and liquidity are scary
I hate to say it, but the charts look frightening. First, the most indicator of the past eighteen months indicator, the NYSE Advance Decline line (NYAD), has delivered the type of technical divergence which has preceded every major stock market decline since 1987. This is evident when one looks at the chart of the Nasdaq 100 Index (NDX), below, which made a new high soon after the February bottom and compare it to the NYAD’s complete lack of confirmation over the same period when it failed to even come close to a new high, signaling the potential for even worse losses awaiting in the wings.
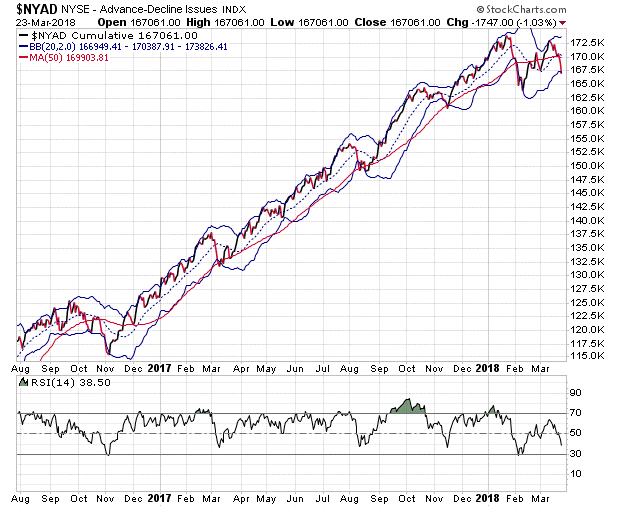
Specifically note the following about the NYAD chart:
1) Since the 2016 electoral win by President Trump, the NYAD has rebounded from every low point – usually a tag of the lower Bollinger Band - to deliver a new high, until the recent February decline where the line faded well below any major high point. This is a big deal, as it is not just a classic technical divergence, such as what occurred in 1987, 1990, 1999, and 2007 but it is also the disruption of a reliable chart pattern that has stood four previous tests in the last eighteen months.
2) If NYAD breaks below the support area established near the 165.0 K line, we may see the market’s breath decline to levels not seen since the summer of 2017 and perhaps worse.
3) The RSI indicator never made it to overbought, which means that there were never any real buyers in the market and that the sellers now have nearly full control of trading.
Nasdaq 100 (NDX) and S&P 500 (SPX) deliver technical failure
Over the last couple of weeks, I’ve noted the negative posture of both the On-Balance Volume (OBV) and Accumulation Distribution indicators (ADI) for the NDX and SPX indexes. Indeed, as the Nasdaq 100 zoomed to a new high the ADI and OBV were slumping, an indication that the sellers were dumping stock onto the dip buyers. This proved to be correct as last week’s swoon in both indexes, combined with the technical divergence in the NYAD delivered confirmation that the market’s trend is now to the down side until proven otherwise.
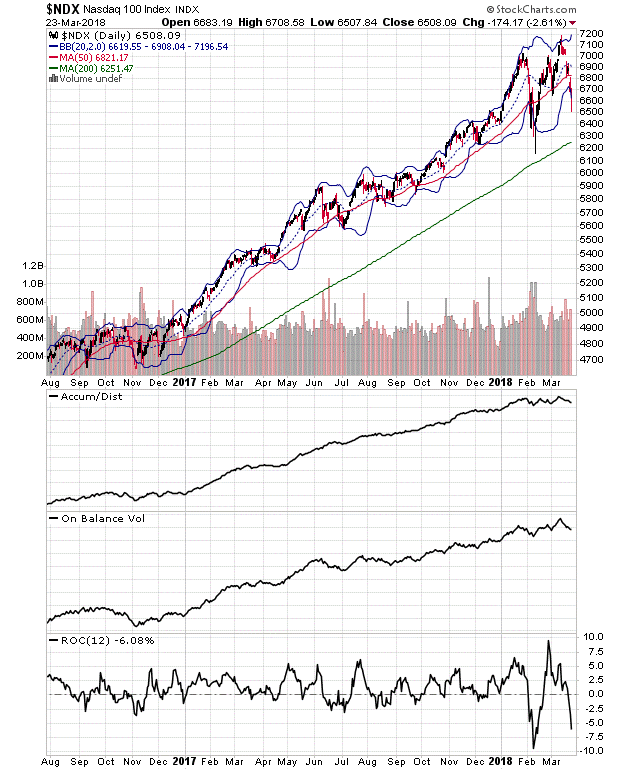
Aside from the generally negative look of the NDX chart, and the soft look of both OBV and ADI, note the following: ROC, a measure of momentum is crashing, suggesting that more selling lies ahead. Next and perhaps more telling, raw volume (pink volume bars) on March 23 actually rose. This argues for further selling as the sellers have few buyers to counter them rather than for the market to find support at the 200-day moving average for NDX, which is likely the next target on the down side.
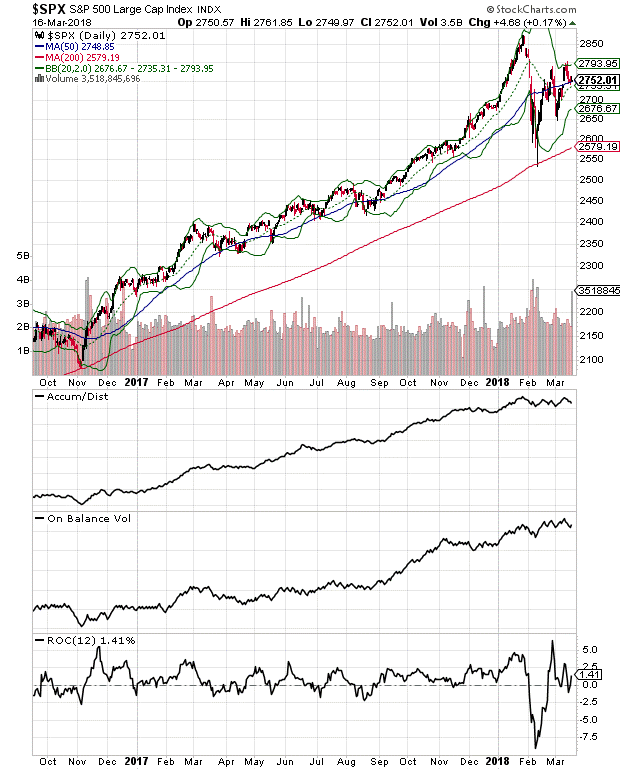
The S&P 500 chart looks even worse. While NDX recently made a new high – albeit a suspect new high – SPX never made it back to its previous high and has now rolled over badly, closing at its 200-day moving average on March 23.
ADI and OBV are negative here too, although raw volume did not rise, which may be worth keeping in mind, although is hard to interpret at the moment. Finally, as with NDX, ROC just crashed again signaling that sellers are in control and that this is not over just yet.
We are in the Trading Zone
We are at a critical stage of this bull market. If the market finds support within 3-5% of the March 23 close on SPX, especially after a very dramatic selling climax and rebound, the bull market may survive, albeit in a battered state. If the selling slows down but continues unabated, we may indeed be in a new bear market, which could be somewhere in magnitude between the 1987 and 2007-2008 varieties – perhaps delivering a 25-30% decline before reversing.
But don’t fret. Successful traders are risk managers and, in this market, staying out of the way is the best strategy. Thus, having high levels of cash, trading small, and having a short-term time frame are the cornerstones of surviving this bear raid and living to trade another day.
Finally, Mr. Travers, if you’re out there, I hope your record sales rise as people get in tune with your anthems. And as the bar bands say: don’t forget to tip your waiters and waitresses; they are working hard for you.
Joe Duarte is author of Trading Options for Dummies, now in its third edition. He writes about options and stocks at www.joeduarteinthemoneyoptions.com.


