

U.S. markets S&P 500 (SPY), Dow (DIA) & Nasdaq (QQQ) present as the strongest opportunity areas, followed by Emerging Markets (EEM), China (FXI), India (EPI) and Brazil (EWZ), writes Ziad Jasani of the Independent Investor Institute in weekly videos and commentary.
Ziad’s market strategy videos recorded Monday:
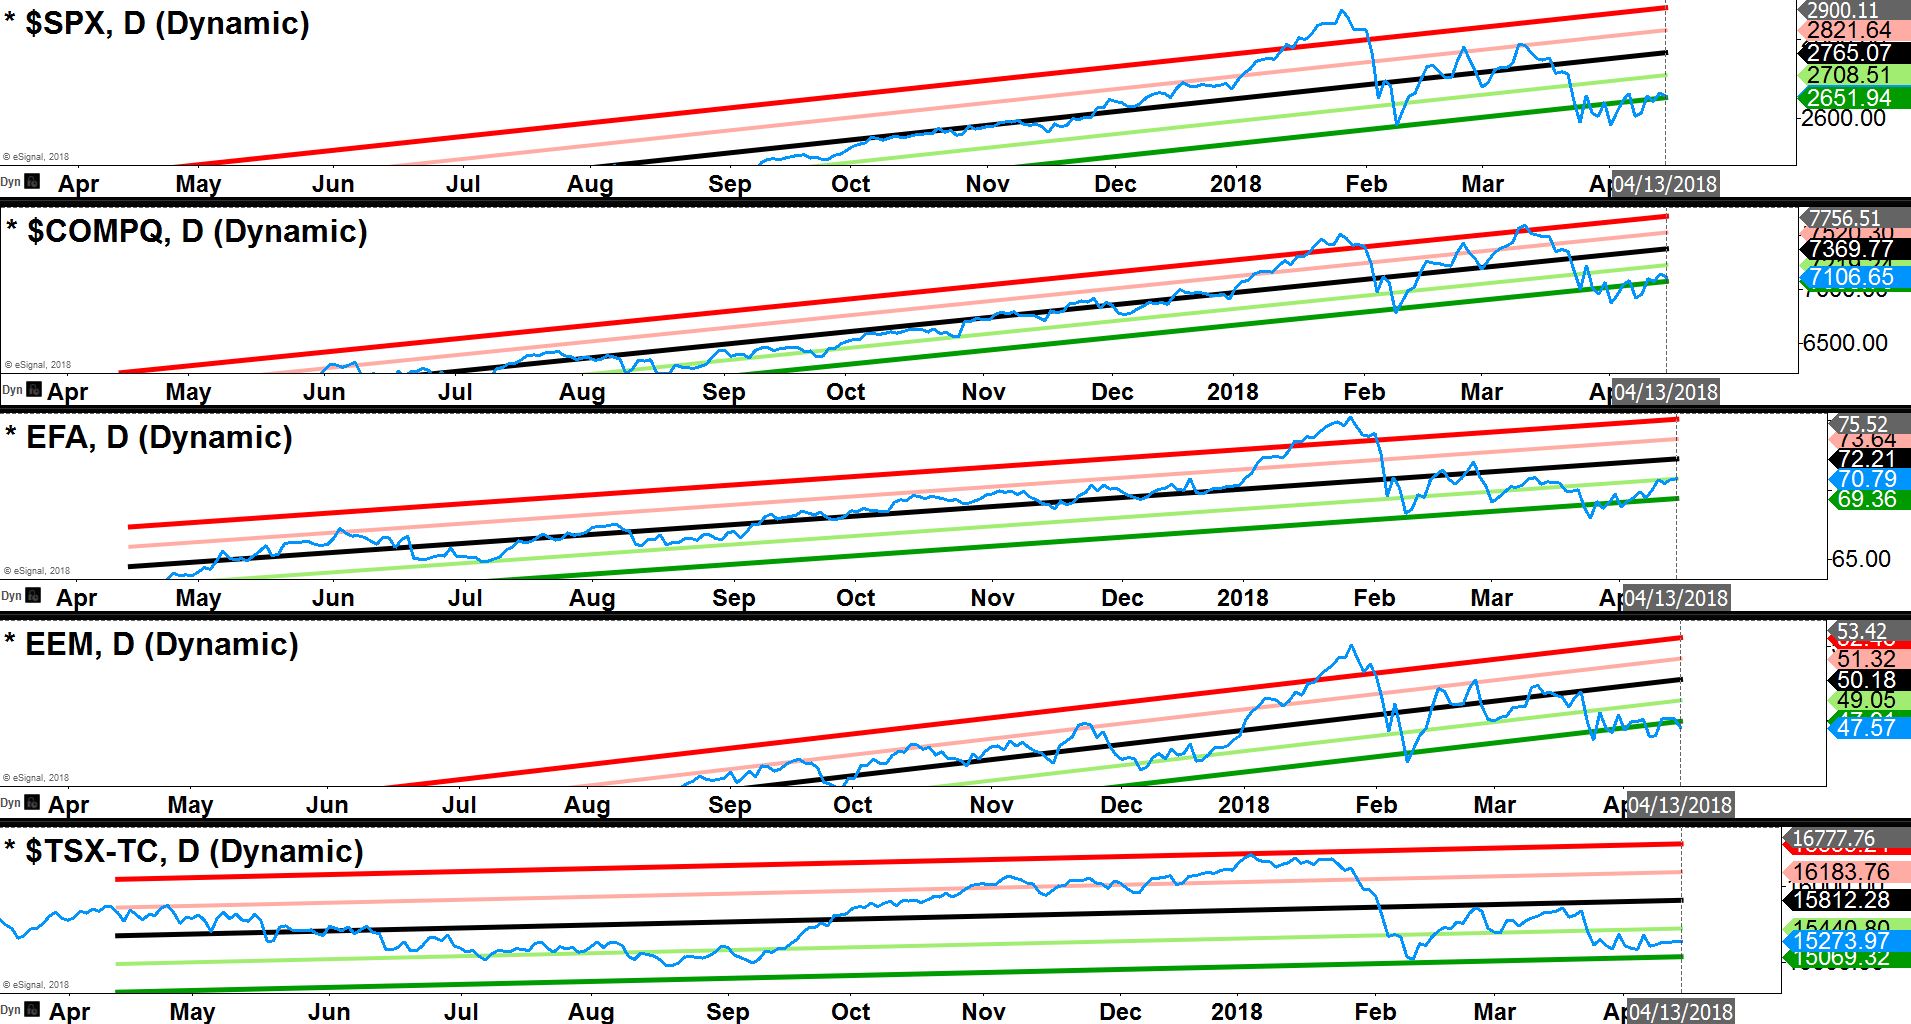
Major Index Direct Price Regression
When humans move very far away from normal routines they tend to come back home.
In markets, we call this “mean-reversion.” Currently, every major trading bloc presents ~2 standard deviations away (near the green line or cheap) from their normal annual routines (black line in channels).
This presentation supports a macro market swing-low formation taking hold this week and pointing each space to their respective homes (black-lines at middle of channel).
But if we end the week below, we may be entering the new-normal of “Correction Part 2.” An early signal would be the S&P 500 < 200-day average.
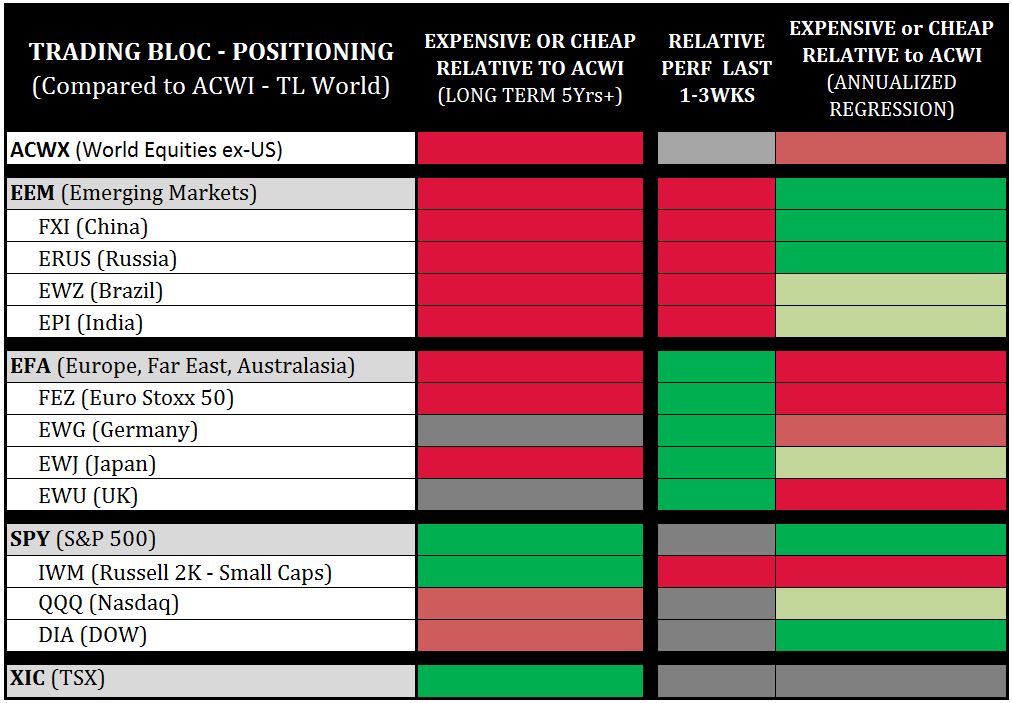
Trading Bloc Positioning
This chart compares major trading blocs back to the entire global equity market (ACWI), to determine which spaces are relatively cheaper.
Why? Capital flows usually tilt towards relatively cheaper spaces, especially if a macro market swing-low formation takes hold.
U.S. markets S&P 500 (SPY), Dow (DIA) & Nasdaq (QQQ) present as the strongest opportunity areas, followed by Emerging Markets (EEM), China (FXI), India (EPI) and Brazil (EWZ).
The TSX presents as neutral, which implies that if the macro market swing-low advances the TSX has a fair chance to pace the world.
Since the late Jan. – early Feb. 2018 market correction has resolved to markets (ACWI, SPY) coming back down to their 200-day averages but left in bounce formation from April 6 we are in “swing-trading-mode” with our short-to-mid-term capital and we remain Hold with our longer-term holdings.
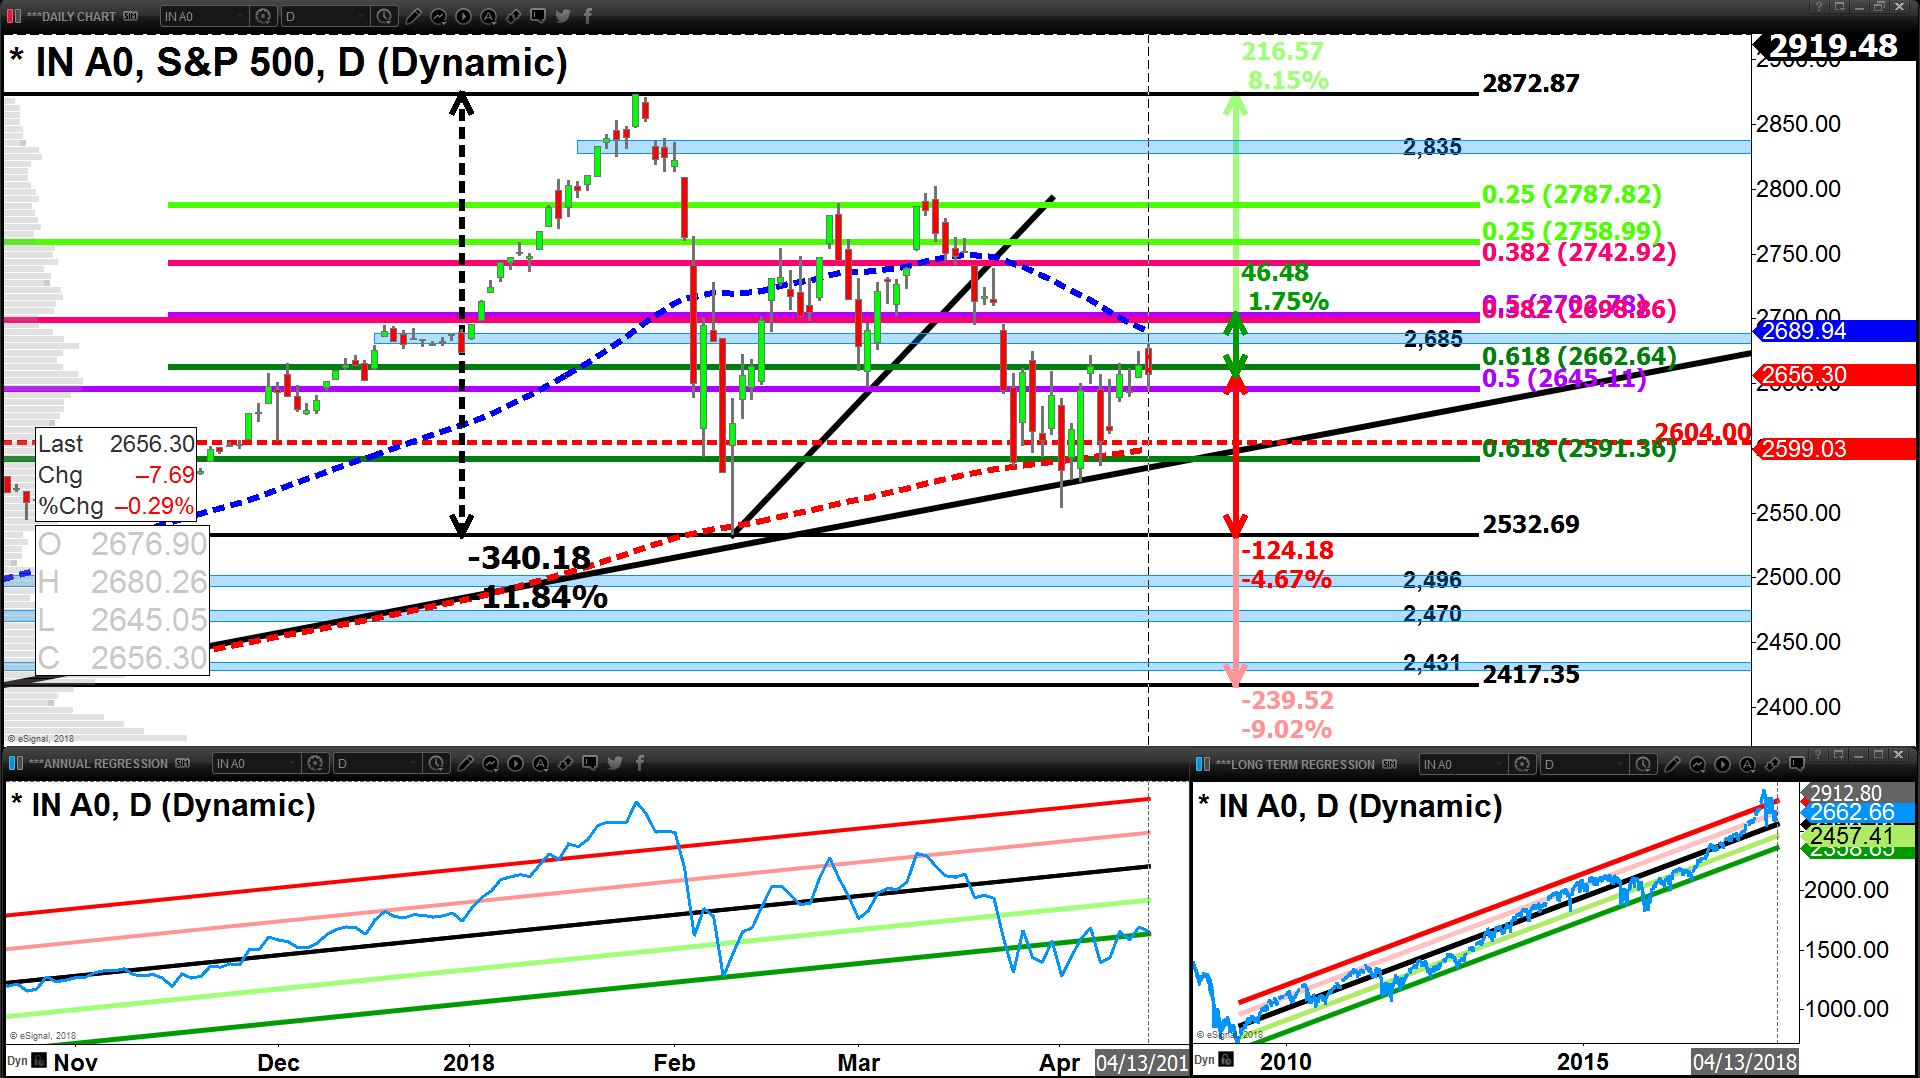
S&P 500 Trading Level Guidelines
The S&P 500 is dislocated and cheap on 52-week routines and readying for a bounce.
If Scenario A or B is playing out, the following sectors would be more opportune to swing trade-long (buy lines included below, if the buy lines are broken “bounce-off” lines included):
• Technology (QQQ, XLK, IYW) • QQQ > $162.72 and/or bounce off $159.75
• XLK > $66.17 or > $67.39 or bounce off $64.94 • IYW > $169.94 or > $173.36 or bounce off $166.51 • Healthcare (XLV, XBI, XPH) • XLV > $82.01 or bounce off $81.22
• XBI > $88.33 or > $90.17 or bounce off $85 • XPH > $41.36 or > $42.16 or bounce off $40.50
• XHE > $69.61 or bounce off $68.34 • Materials (XLB, XME)
• XLB > $58.04 or > $58.63 or bounce off $57.20 • XME > $35.82 or bounce off > $34.65
• Industrials (XLI) • XLI > $73.86 or > $75.11 or bounce off $72.42 • Financials (XLF, KBE, KRE, KIE) • XLF > $27.08 or > $27.90 or bounce off $26.19
• KBE > $47.63 or > $48.66 or bounce off $46.61
• KRE > $60.19 or > $61.09 or bounce off $58.47
• KIE > $ 30.43 or $30.80 or bounce off $30.03 • Discretionaries (XLY) • XLY > $101.78 or > $103.22 or bounce off $98.91
• Energy (XLE, XOP, XES) – if Oil > $67-$66.89 • XLE > $71.41 or bounce off $67.63
• XOP > $36.96 or > $37.55 or bounce off > $35.07 • XES > $16.60 or > bounce off > $15.04.
If the 10-year U.S. Treasury yield gets and stays below 2.8% and Scenario A is playing out for equities, we can consider a short-term swing trade (long) within the Defensive Sectors.
A break below 2.7% on the 10-year could open the idea of longer-term acquisition of Defensives:
• Utilities (XLU) > $49.35 or > $51.21 or bounce off $49.05
• Staples (XLP) > $52.87 or > $53.12 or bounce off $51.33
• REITs (XLRE, VNQ) • XLRE > $30.95 or bounce off $30.03
• VNQ > $73.95 or > $75.57
• Still want to avoid Telecom (IYZ).
View the Independent Investor Institute trading ideas and strategies videos here.


