

Three scenarios: Bullish, Dump ’N’ Pump and Bearish. More tactical scenarios for this week, writes Ziad Jasani of the Independent Investor Institute in weekly videos and commentary.
Ziad’s market strategy videos recorded Monday:
U.S. banks bruised Mr. Market, but didn’t break “market-sell-levels.”
The macro market swing low in formation starting March 23 – 26 is still in play. U.S.-Syria attacks have not increased volatility over the weekend (U.S. allies generally supportive).
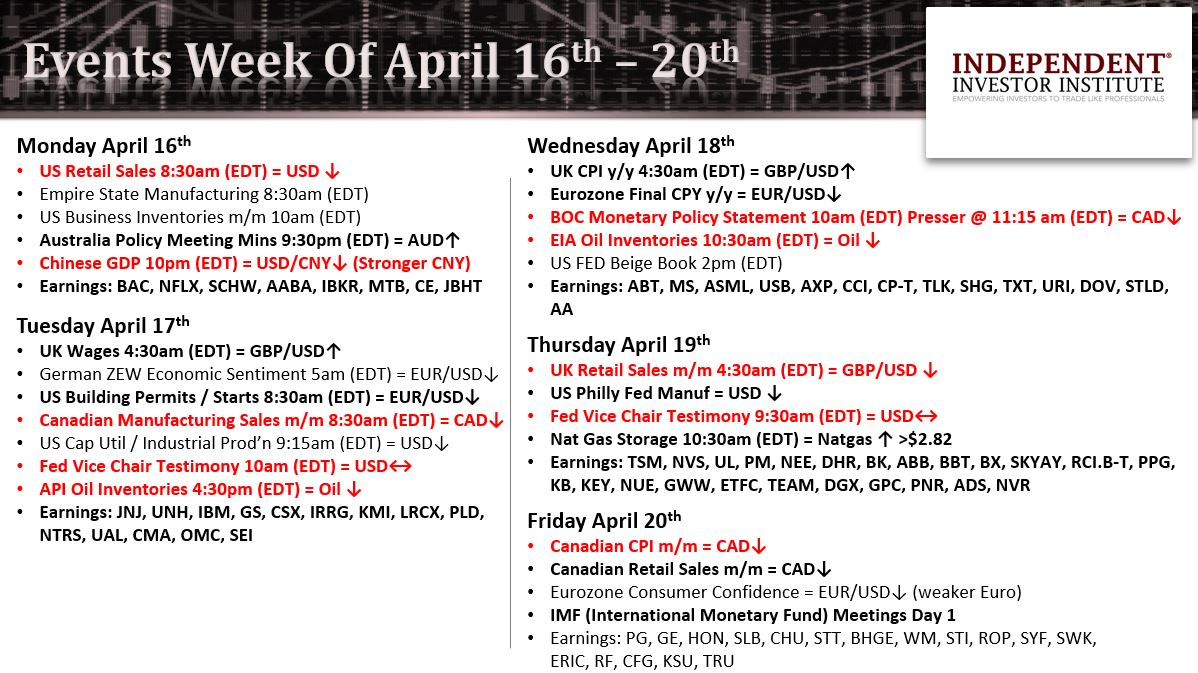
So, we’re back to Q1 earnings focus and a week that starts off with U.S. retail sales data, where a miss is expected, along with a mixed-to-weaker start to Equities.
But Q1 earnings are likely to support Equity Markets, closing us higher or in a bounce to end the week.
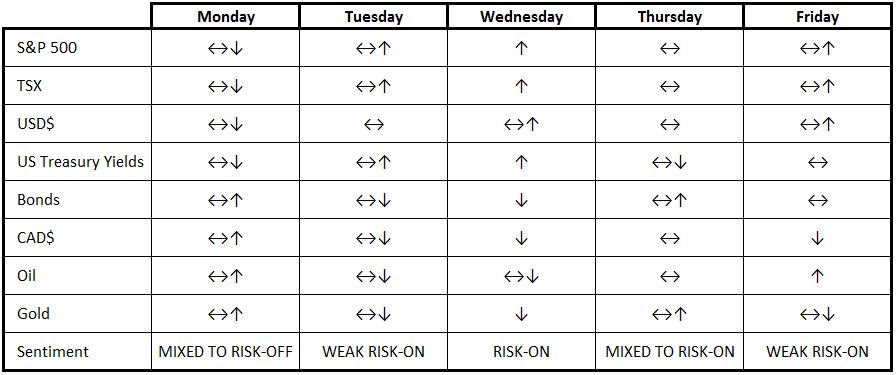
The projected flow of macro-asset-behavior for the week is below.
Note: Due to the U.S. bank-bruising April 13 injecting uncertainty on earnings, the flow below may be considerably changed.
3 scenarios for the week ahead (Note: Above flow is Scenario A or B, not C)
• (A) BULLISH ↑: Signal ◊ S&P 500 (SPX) directly rises and holds above 2,663
• (B) DUMP’N’PUMP ↓ ◊ ↑: Signal ◊ S&P 500 < 2,645 then bounces up off 2,620
• (C) BEARISH ↓: Signal ◊ S&P 500 < 2,620 and/or breaks Feb. 9 lows (2,533) and stay.
In the case of Scenario A or B presenting the following spaces and decisions are viable on a swing-trading-basis:
• U.S. Equities: S&P 500 (SPY), Nasdaq (QQQ), Dow (DIA): Hold-To-Buy if S&P 500 > 2,645, 2nd Buy if S&P 500 > 2,663 or if the levels break de-risk, target bounce again up off 2,604
• OIL: Longs Hold if Oil > $67, Hold-To-Buy if Oil > $68 (USO, HOU-T)
• GOLD: Hold-To-Buy if Gold > $1,331 for a move up to $1,355; 2nd Buy > $1,365
• BONDS: Hold if 10-year U.S. Treasury < 2.9%; if >2.9% Sell, if < 2.7% Buy
• USD (UUP): Hold if UUP > $23.40-$23.30; if >$23.75 Buy, if 15,175-110, 2nd Buy if TSX > 15,300 • USD/CAD (DLR-T): Hold-To-Buy DLR-T > 1.258-1.254 | DLR-T > $12.57 -$12.48
In the case of Scenario C presenting the following decisions are suggested:
• if the S&P 500 < 2,620 and/or breaks its 200-day average (2,599): SH, IWM, PSQ, DOG
• if the S&P 500 < 2,533 (Feb. 9 lows) it would signal the 2nd leg of short/inverse trades
• if the TSX breaks below 15,175-110: HXD-T
• if the TSX breaks below 14,950 it would signal the 2nd leg of short/inverse trades
• if the S&P 500 breaks below Feb. 9 lows (2,533) and remains below & longer-term investors would reduce long-side exposure by 33% to 50%
• if the TSX breaks below Feb. 9 (14,786) and remains below, longer-term investors would reduce long-side exposure by 50% to 70%.
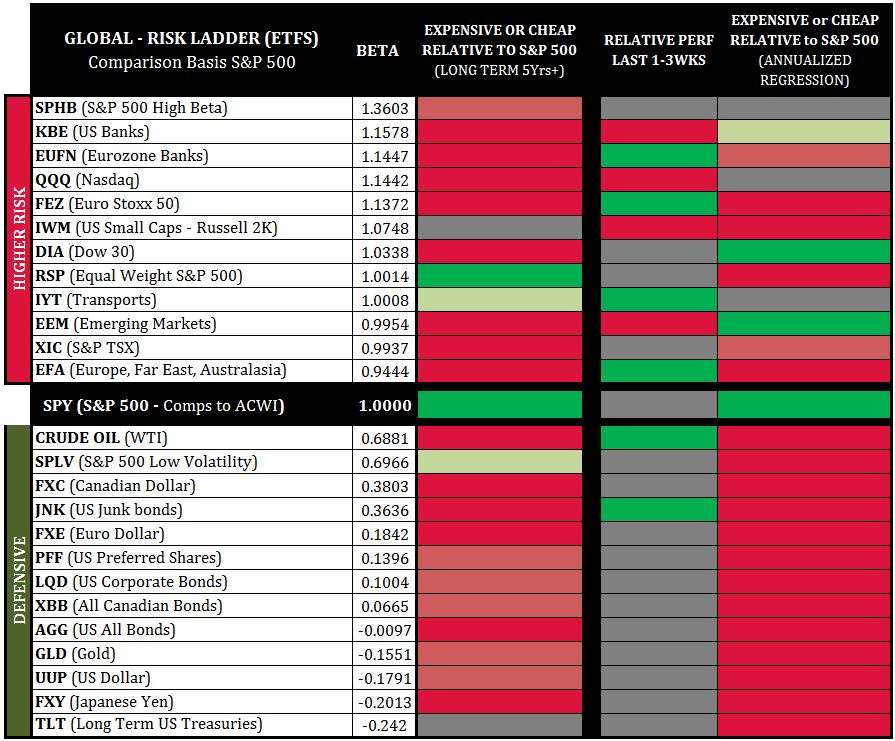
Looking at the third column to the right we see a comparison of higher-risk asset classes and defensive asset classes back to the S&P 500 (SPY) on an annual basis.
When we see more green above the SPY-Line (middle line) and more red below we have a general “risk-on” signal; and vice-versa (red above, green below would be “risk-off”).
Currently, we have a weak risk-on posture better characterized as mixed, with Defensives expensive to very-expensive and Higher-Risk polarized with the TSX (XIC), Russell 2000 (IWM) and Eurozone (EFA, FEZ) presenting as expensive while the rest presents neutral to cheap.
This implies there is room for the current macro market swing low (forming since March 23) to advance in the week ahead (signal would be the S&P 500 staying above 2,663), but it is likely short-lived (max 2-3 weeks).
With Defensives presenting as very expensive, we must keep an eye on any data that stokes the inflation-fire this week (UK CPI April 18, CAD CPI April 19).
View the Independent Investor Institute trading ideas and strategies videos here.


