

The leading index and CNN Fear & Greed Index signal stocks will rally in the next few months. The Philly Fed report was bullish on inflation. The new orders decline signals manufacturing isn’t great. The ECRI index signals bad news in the second half, says Don Kaufman.
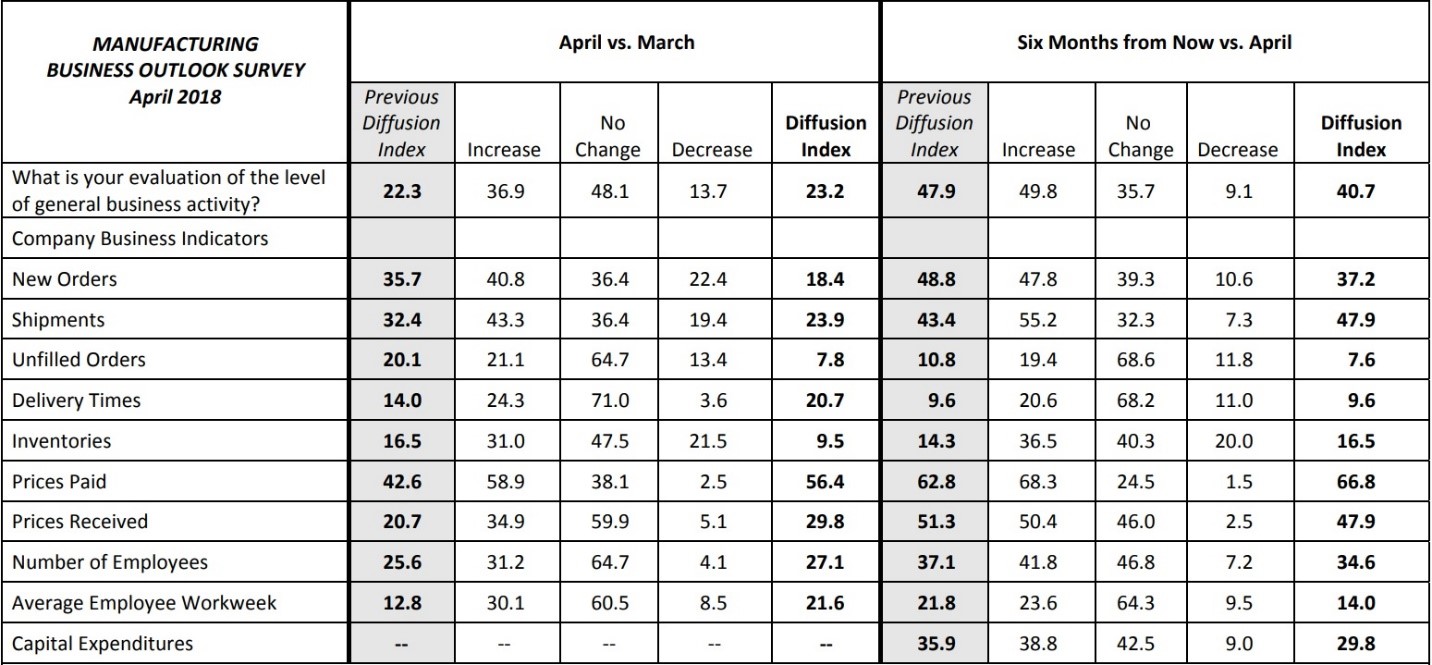
The Philly Fed report beat estimates which is surprising since the New York Fed manufacturing report was so weak. The April report came in at 23.2 which beat the consensus of 20.1 and the prior report of 22.3.
Even though the headline was strong, the new orders index signaled weakness as it went from 35.7 to 18.4 as you can see in the table below. The unfilled orders index was also down sharply as it fell from 20.1 to 7.8. Furthermore, the expectations index fell from 47.9 to 40.7. This is the least optimism since July 2017.
It’s clear this report was stronger than the Empire State Index, but it still doesn’t inspire optimism. The shipments index also declined as it was down from 32.4 to 23.9.
The big reason the index was up was because the prices paid index went from 42.6 to 56.4 and the prices received index went from 20.7 to 29.8. Those readings were a 7-year high and a 10- year high respectively. These support the latest increase in inflation expectations as the tariffs have increased prices for some industrial metals. The price of aluminum is up about 25% in the past two weeks. The slowing orders may have been behind the improvement in the delivery times index which went from 14 to 20.7.
My takeaway from this report is that it shows inflation is increasing and optimism isn’t falling off a cliff like the NY Fed index showed. This slightly improves my outlook for how the economy did in April.
The Richmond Fed report next week will be the tie breaker between the NY and Philly Fed reports. The increase in some of the metals prices hasn’t made an effect on the CRB commodities index as its up much less than aluminum in the past few weeks. I could be wrong about weak economic growth hurting commodities because as I’ve mentioned previously they did well in 2007 and the first half of 2008 despite the economy entering a recession.
This time commodities have the benefit of Trump talking down the dollar and instituting tariffs.
Jobless claims and leading indicators
The jobless claims report was solid again as the report showed 232,000 claims which were down 1,000 from last week and 2,000 above the consensus. It’s hard to imagine the claims improving much from here.
The fact that the claims didn’t fall further could mean subpar jobs growth in April as we approach full employment. It’s fair to expect somewhere in the range of 100,000 and 150,000 jobs created in April.
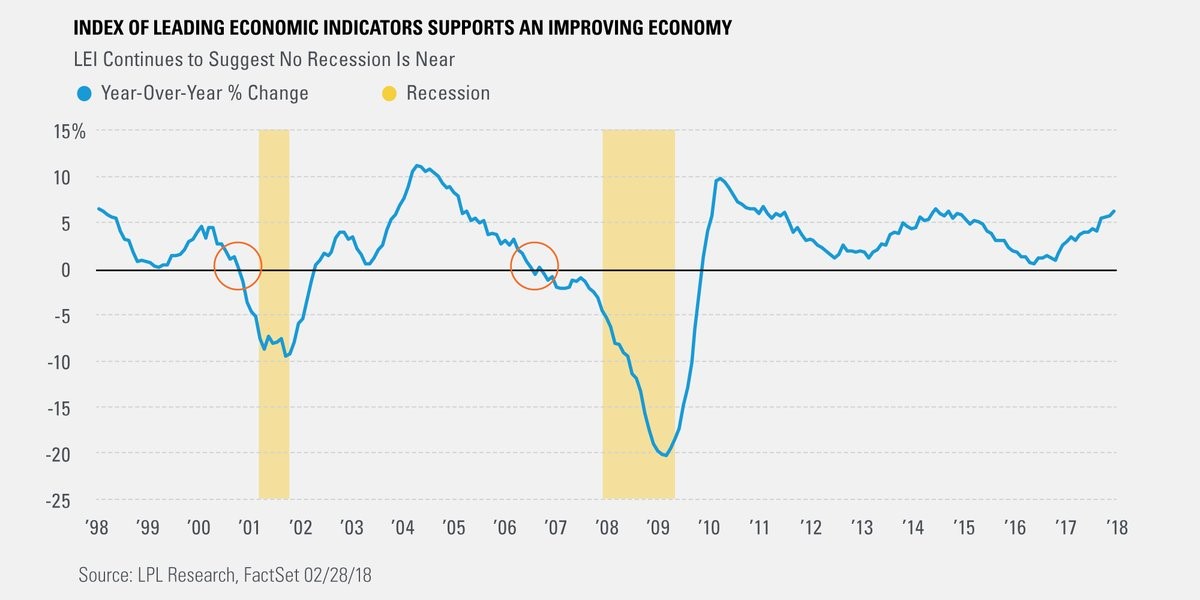
One of the best indicators for the future economic trends is the leading index report. It doesn’t see much slowing in Q1. Keep in mind, I’m expecting 2.0% to 2.5% GDP growth, so it’s not like I’m expecting growth to fall off a cliff.
Still, the growth rate shown in the chart below signals growth is nearly as high as 2014, continuing the strength seen in Q4 2017. The month over month improvement for March was 0.3% which met the consensus expectations. This was below the prior month’s revised growth of 0.7%.
GDP estimates
The consensus for real GDP growth in Q1 is 2% and the range is from 1.3% to 2.8%. Even the high end is below the 2.9% growth seen last quarter. Real consumer spending is expected to drive the weakness as growth is expected to be 1.2%. The range is from 0.7% to 2.4% which is way below the 4% growth last quarter.
As you can see, this is closer to the negativity I express than the positivity expressed in the leading indicators report. The NY Fed is expecting 2.91% growth as data revisions were the biggest reason why the growth estimate increased 0.12% from last week. The Q2 growth estimate is an optimistic 3.03%.
If growth really does meet these estimates, then the decline in stocks isn’t rational. As I’ve mentioned previously, the Atlanta Fed’s Nowcast expects 2% growth. Its final estimate will come out April 26 which is the day before the GDP report comes out.
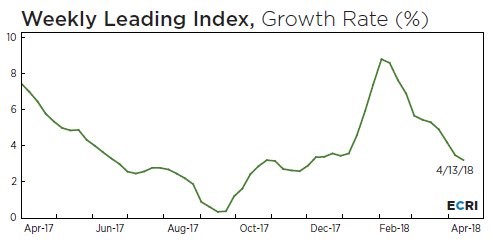
The St. Louis Fed’s Nowcast is still very optimistic as it is expecting 3.5% growth. As you can see from the chart below, the ECRI report looks nothing like the leading index report. The growth rate in the week ending April 13 was only 3.2%.
This isn’t terrible, but it’s a sharp decline from the over 8% growth in February.
The CNN Fear And Greed Index
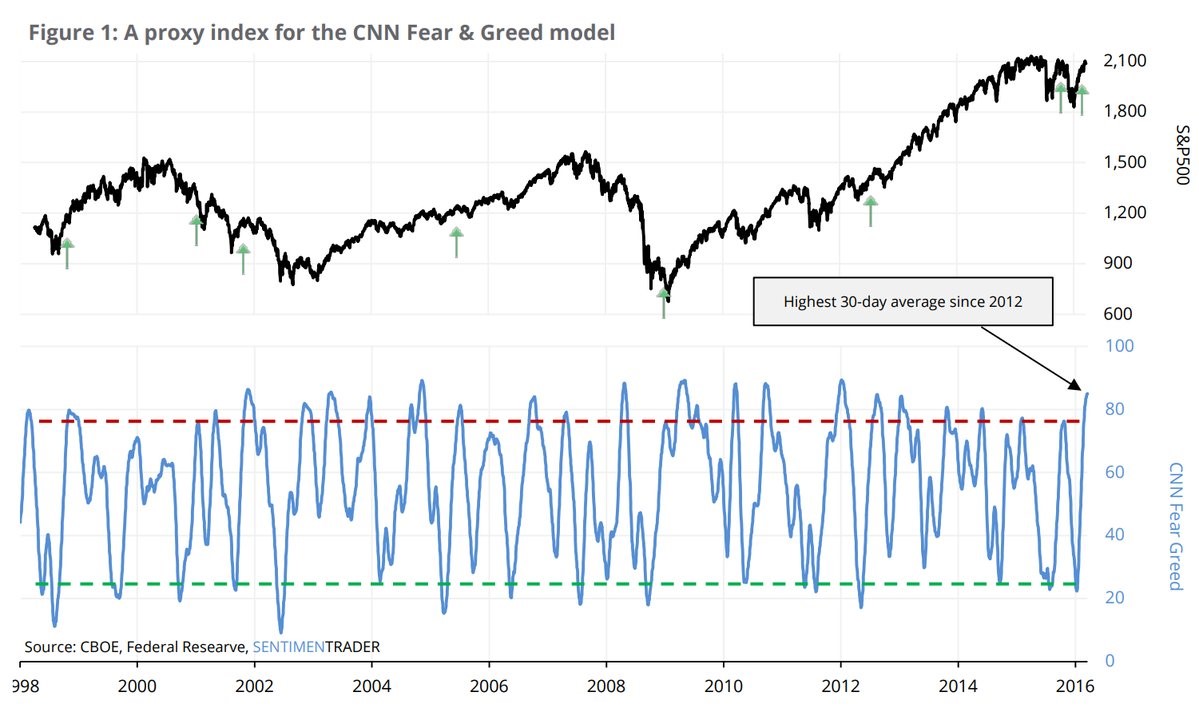
The latest reading of the CNN Fear and Greed index shows 38 out of 100 which signals fear. This is an improvement from the past few weeks which showed readings in the single digits. The S&P 500 was up 14 points this week as the last 2 days ruined what was looking like a great week. I have expressed skepticism of this index, but there is new research which proves me wrong.
The chart below shows the historical CNN Fear & Greed Index versus the S&P 500 (SPX). From 1998 to 2016, the index has been below 29 10% of the time. After these periods, the S&P 500 was up an annualized rate of 33.3%.
When the index was above 79, which occurred 10% of the time, it returned an annualized loss of 1.3%. In between those points, the S&P 500 returned 3.7%. Therefore, this is a great index for timing the end of trends in stocks. This is very bullish for stocks now because this index was in the single digits recently. The reading which showed the highest optimism since 2012 in early 2016 wasn’t wrong because the market did nothing for a few months before rallying in the summer.
Monday afternoon, the Fear & Greed Index was 42.
Trading Lesson: How the Investopedia Anxiety Index reflects markets
Conclusion
The leading index and the CNN Fear & Greed Index signal stocks will rally in the next few months. The Philly Fed report was bullish on inflation, but the new orders decline signals the manufacturing economy doesn’t look great. The ECRI index signals bad news for the economy in the second half.


