
What can the search patterns of Investopedia readers tell us about the state of the economy, asks William Kenton, director of content. This is the story of how the popular Investopedia Anxiety Index was created.
In 2012, Seth Stevens-Davidowitz, a doctoral candidate in Economics at Harvard, published “How Racist Are We? Ask Google” in the New York Times explaining how he used Google search results to uncover voter bias.
“Google, aggregating information from billions of searches,” he said, “has an uncanny ability to reveal meaningful social patterns.”
Stevens-Davidowitz went on to earn his doctorate and author the book Everybody Lies: Big Data, New Data, and What the Internet Can Tell Us About Who We Really Are.
In 2015, three years after Stevens-Davidowitz published his Times article, I went to David Siegel, Investopedia’s CEO, to ask him if we could try something similar with Investopedia data.
Investopedia has 30 million monthly unique visitors and a record of the Investopedia content they found through Google: hundreds of millions of searches that landed on tens of thousands of URLs leading to quality content. It goes back to before the collapse of Lehman Brothers and the 2008 financial crisis.
I represented the editorial team and partnered with Ronnie Jansson in our data science division to search for patterns in our most highly trafficked materials. With Steven-Davidowitz's hypothesis in mind, we asked ourselves, “What can the search behavior of our readers tell us about the state of markets and the economy?"
First, we carefully selected a dozen terms on topics that suggested investor fear, like "default," and opportunistic terms, like "short-selling."
Finding a signal in noisy web traffic data is difficult due the varied seasonality of our readership (for instance, traffic declines on the weekends) and exogenous factors like Search Engine Results Page (SERP) rank.
Our second move was to develop a methodology to remove this noise and produce an index that robustly tracks the actual ebb and flow of interest in the chosen topics. The result is the plot below.
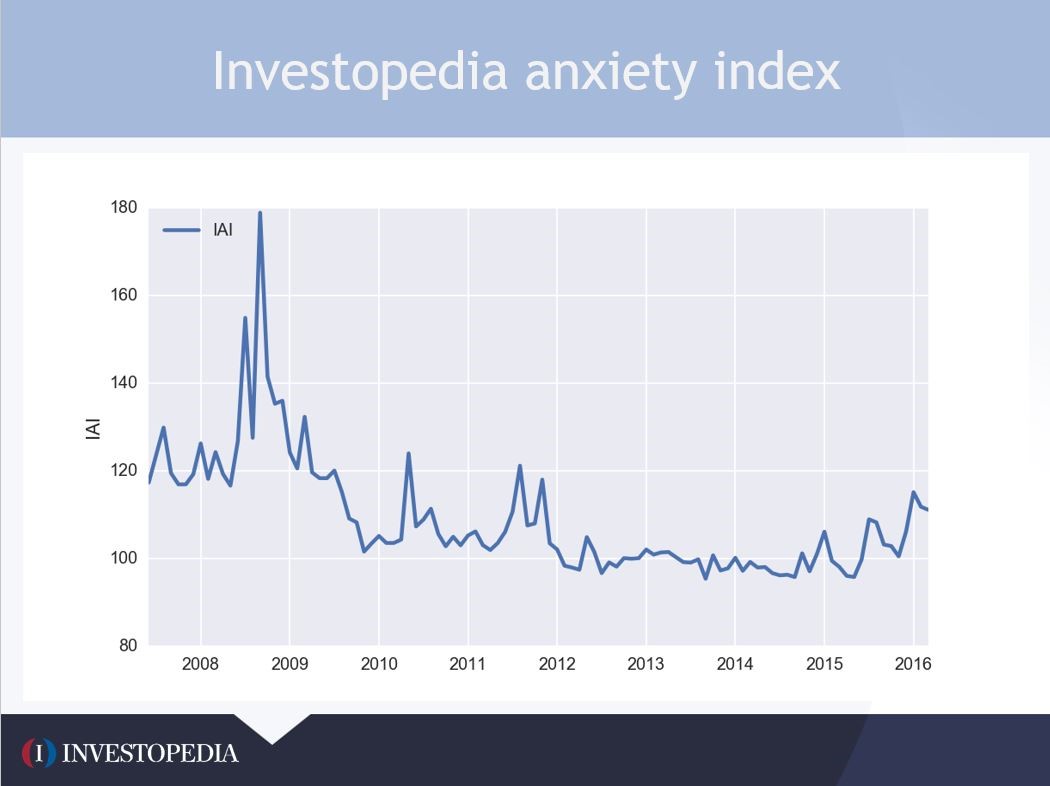
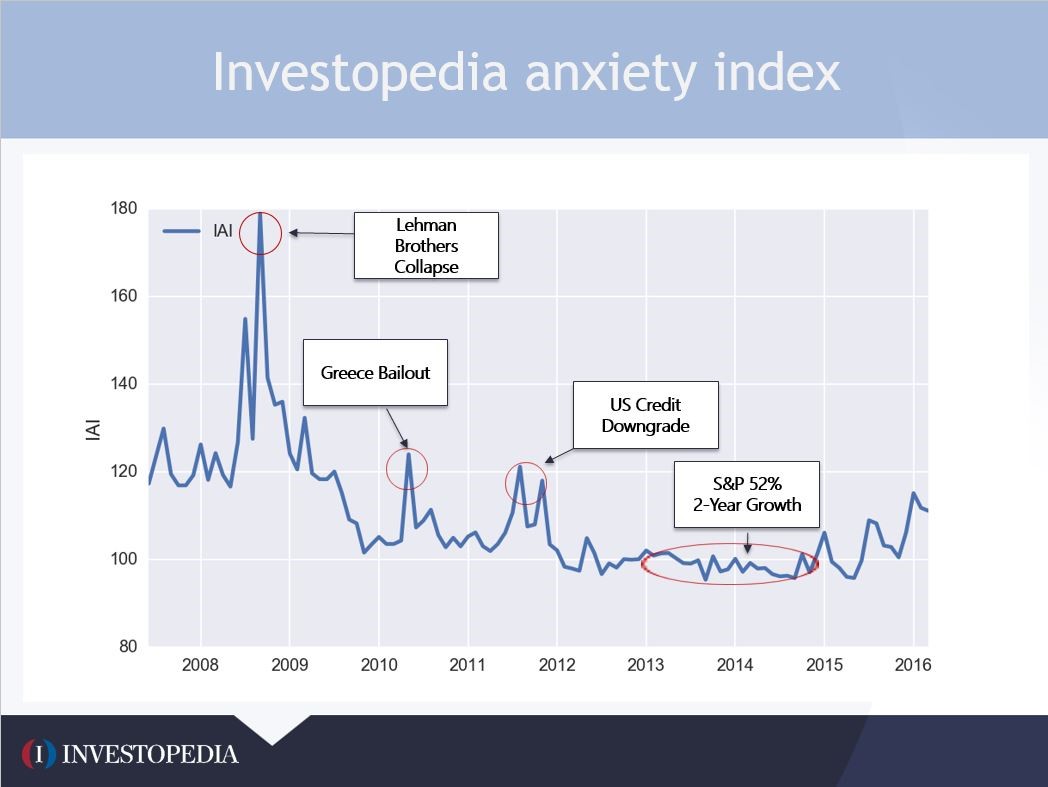
When we looked at the results of the analysis the first time, we found that the major peaks in the index occurred exactly where they would make sense: around major events like the fall of Lehman Brothers (by far the most significant peak), the Greek debt crisis and the U.S. credit downgrade by Standard and Poor’s.
In the first version of the index, we used 13 key concepts.
In the final version of the Investopedia Anxiety Index (IAI) we narrowed our base to a set of urls with high organic entrances – meaning page views that came from Google and signal high reader intent. We also now use several thousand more term pages in the normalization procedure. In total we used close to one billion page views to produce the 9 year monthly IAI plot.
We had set out to create a proxy or index for investor sentiment, but we needed an outside point of reference. The Chicago Board of Options Exchange’s Volatility Index (VIX), often referred to as “the fear index,” measures stock market volatility and is commonly used as a gauge of investor fear. We plotted the VIX next to our new creation, and the results spoke for themselves:
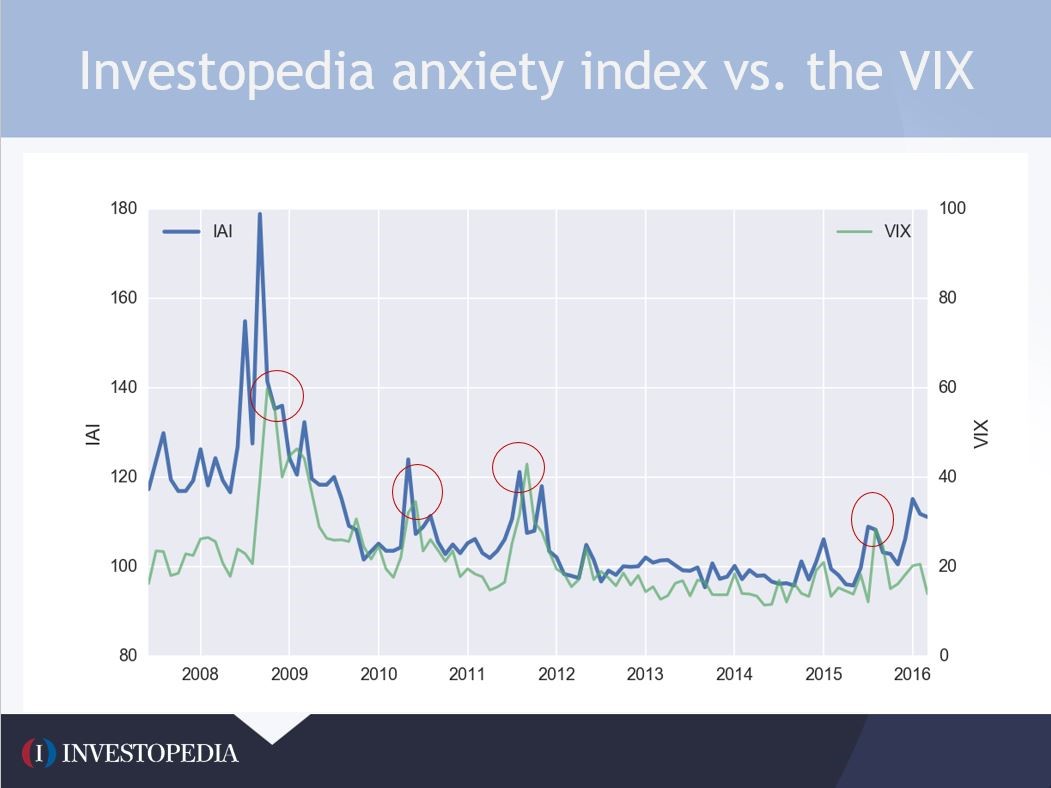
Over a period of almost a decade, the large scale features are very similar in the VIX and the IAI despite measuring different phenomena (stock market volatility and content consumption, respectively). And more importantly, it looked at first glance as if the IAI was predicting the VIX.
For more than a year prior to the peak of the financial crisis in September 2008, the IAI was profoundly elevated (around 120 or so – a level that had not occurred in a single month in the most recent four years), while the VIX remained subdued, around 20. In other words, based on the VIX alone you would be caught completely off guard by the biggest financial crisis of our generation, whereas the IAI was an alarm blaring for more than a year before the crisis hit.
It was such a stunning result, we doubted it at first. Our data was collected monthly until 2011, so we worried there was still too much noise to prove our hypothesis that in the process of educating themselves, Investopedia readers were signaling a market crash.
Then a colleague of Ronnie’s Saeed Amen, author of the book Trading Thalesians: What the Ancient World Can Teach Us About Trading Today, did a simulation of three trading strategies:
- Long only: stay long only
- IAI filter: stay long, unless IAI score is at an extreme (high/low) in which case we go flat
- VIX filter: stay long, unless VIX score is at an extreme (high/low) in which case we go flat.
What he found was the IAI strategy beat the others. We felt good enough about the result that we published the IAI that week. In the intervening years, we have refined the process, but the underlying theory is the same: In the process of educating themselves about their economic and financial condition, Investopedia readers give us a signal to see where our economy and financial system as a whole are headed.
Jeanine Mioton is communications manager of Investopedia.com. Email: Jeanine.Mioton@investopedia.com


