State of the market—May was a profitable month for stocks and June is starting off well. The S&P 500 SPDR (SPY) is at its highest level since March. Small-cap ETFs such as IWM and IJR are making record highs, confirmed by the NYSE advance-decline line, writes Dr. Marvin Appel.
Stocks have digested a lot of bad news without falling significantly, which is bullish. Early in the year rising interest rates were a fear, but the recent multi-year highs did not phase the markets.
Similarly, the first hint of a potential trade war roiled stocks, but subsequent threats did not. Most recently, the election of a populist, pro-deficit government in Italy has had limited repercussions.
Our models remain on a Hold, suggesting profitable market conditions but with potentially significant market volatility.
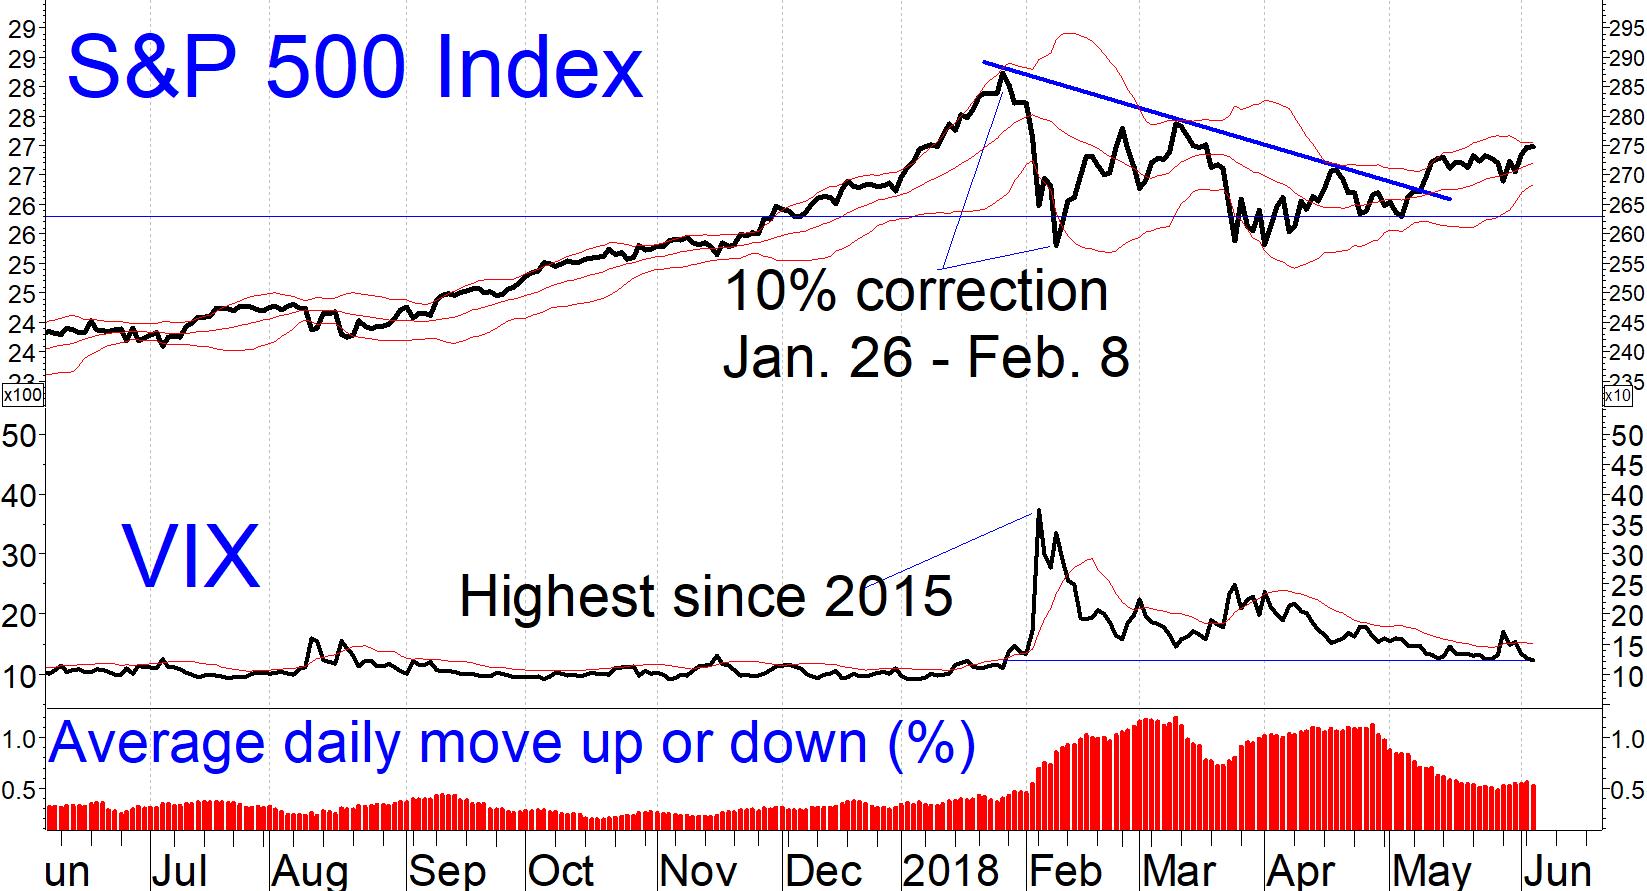
Option implied volatility (VIX) is at its lowest level of the year. (See chart below.)
As a short-term trading indicator, this observation has limited prognostic value; intra-day or day-to-day moves in VIX generally mirror rather than lead fluctuations in the S&P 500. However, the longer-term implications of a stable VIX are bullish.
Conversely, a sustained gradual rise in VIX would be bearish. One of our indicators is based on VIX, and that indicator remains bullish.

Emerging market update
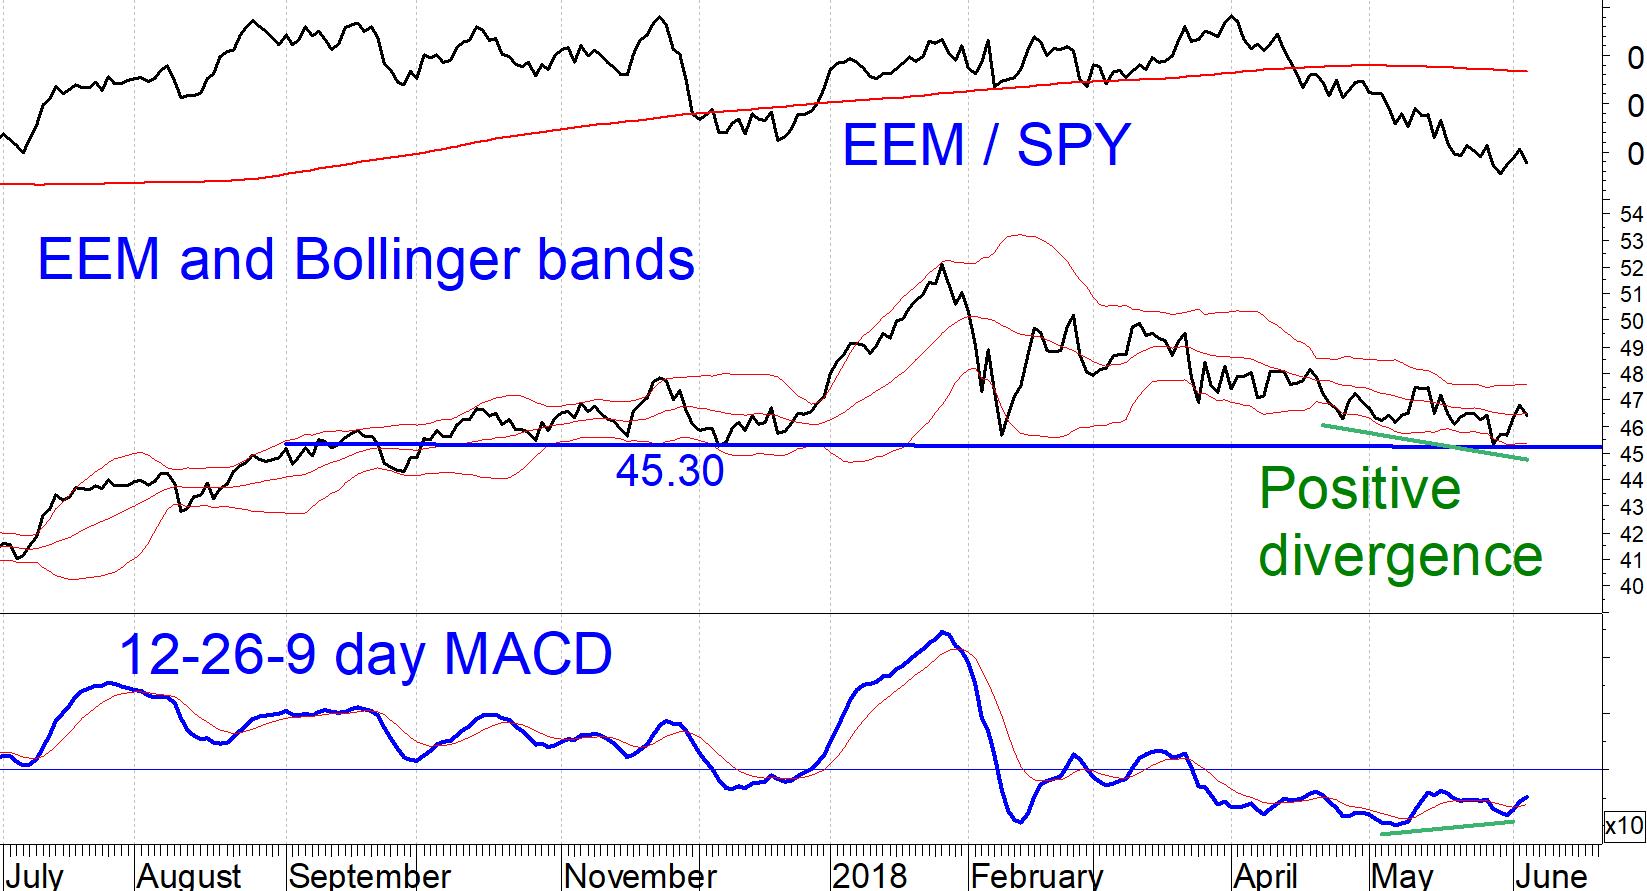
The relative performance between the iShares MSCI Emerging Markets Index ETF (EEM) and SPY has hit its lowest level since March, 2017 as the result of particularly weak performance by EEM since early April. (See EEM/SPY in the chart below.)
When EEM/SPY is falling it means that EEM is weaker. Problems in emerging markets include rising U.S. interest rates and recent strength in the U.S. dollar. (DXY) (Much emerging market debt is denominated in dollars, so a rising U.S. dollar increases the debt burdens of emerging market borrowers.)

Although our asset allocation model now favors SPY over EEM in terms of profit potential, the EEM chart does suggest that downside risk is limited for two reasons.
First, EEM appears to enjoy strong support at 45.30 which was tested in late May.
Second, EEM has formed a positive divergence with its MACD.
You can act on these observations by writing covered calls on EEM. For example, on June 6 with EEM trading near 47 you could write covered 47 calls expiring 7/20/2018 for $0.88 bid, a time value of 1.9%. The analogous position with SPY calls would fetch only 1.1% in time value.
Junk bond update
This has not been an easy year for junk bonds, although times are even worse for investment-grade credits.
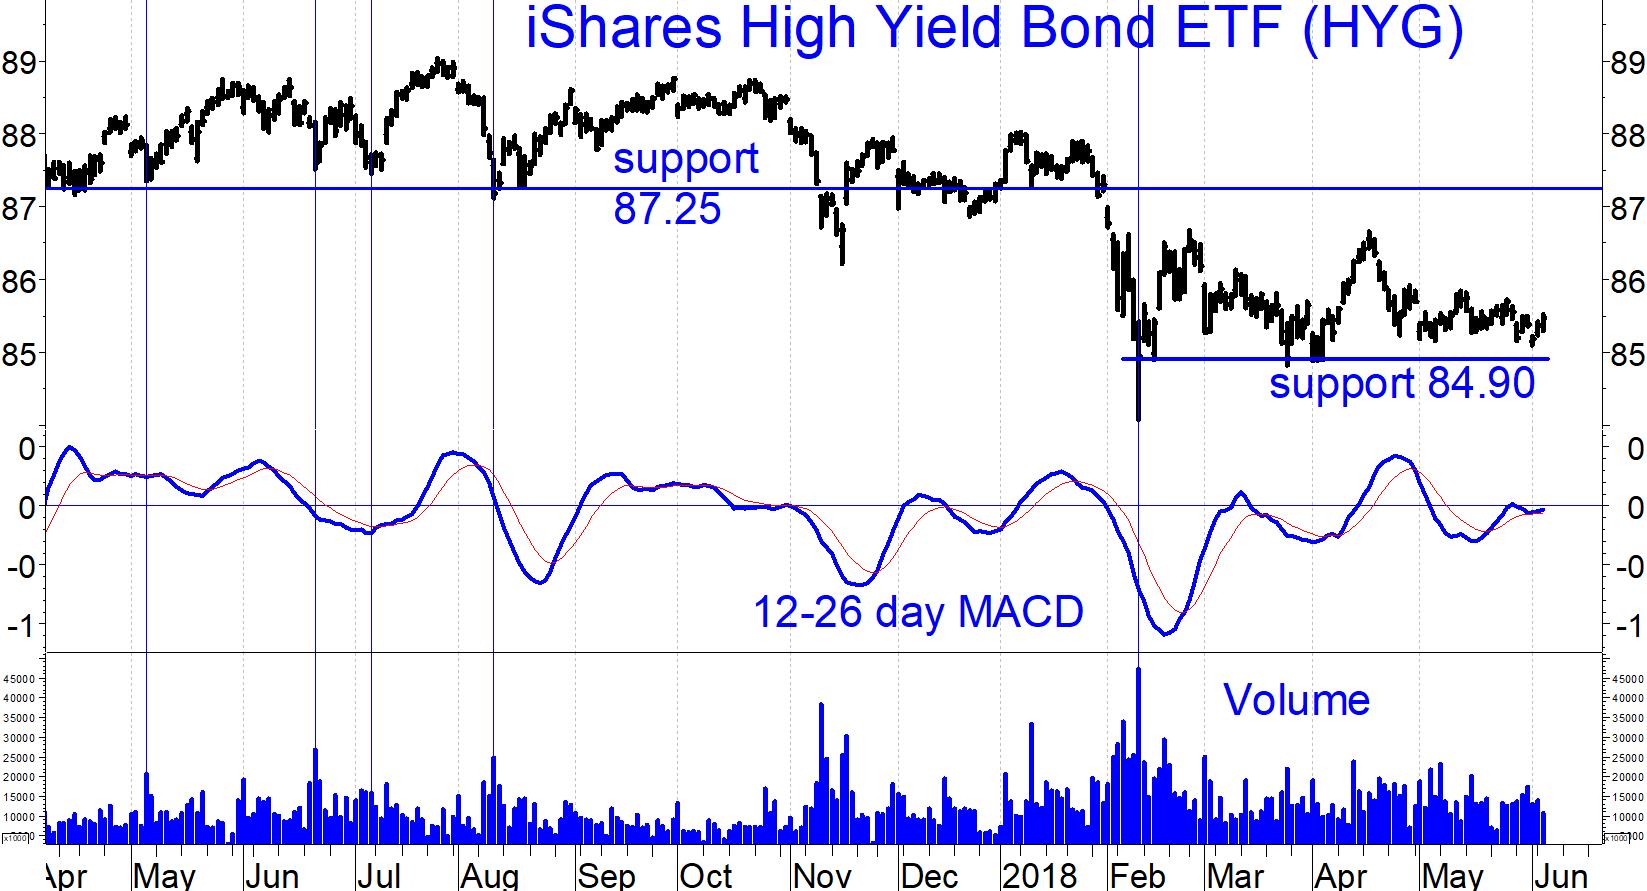
The chart below shows that a popular corporate iShares iBoxx $ High Yield Corporate Bond ETF (HYG) has found support around 84.90. MACD is on a Buy signal, but one not confirmed by any positive divergence or rising double bottoms. I rate the MACD as neutral.

Our high yield bond fund timing models remain on Buy signals, suggesting that we should ride out this year’s modest losses. However, floating rate bond funds remain more attractive than corporate high yield bond funds. As a result, we have allocated more of our clients’ capital to floating rate funds.
—Marvin Appel
Sign up here for a free three-month subscription to Dr. Marvin Appel’s Systems and Forecasts newsletter, published every other week with hotline access to the most current commentary. No further obligation.
Watch Dr. Marvin Appel share ideas on MACD during interviews at Traders Expo New York:
I find a weekly MACD is most effective for bonds.
Duration: 3:41
Recorded: Feb. 25, 2018
Duration: 2:57
Recorded: Feb. 25, 2018.


