

Early Q3 data in July confirms what real-time U.S. financial markets have been saying for months: The U.S. economy is entering a period where growth will slow. This is the first change in 24 months to this growth-accelerating regime, writes Landon Whaley Wednesday.
Last week’s four top-performing sectors say it all: REITs, healthcare, consumer staples and utilities. We must also point out that this outperformance by the “slow growth” sectors came against a backdrop of bullish earnings in growth sectors and bullish economic growth data with the latest jobs reports.
This isn’t a one-week phenomenon, though. Our U.S. Shift Work macro theme is just beginning to play out, and we expect to be trading this theme for the better part of the next year.
In this week’s Macro Theme, we review U.S. Shift Work. We rolled out this theme on April 9 and have since updated it on several occasions. By mid-May we were starting to see market-related signs that it was beginning to take hold.
This week we discuss a new development: economic data is beginning to align with the signal that “slow growth” asset classes have been giving for a couple of months now.
Fundamental Gravity says what?
Whenever we evaluate a market opportunity, we always begin with the Fundamental Gravity. The reason for this approach is because the two chief variables impacting the risk and return of asset prices are: economic conditions and how central banks respond to those conditions. Together, these variables drive what we call an economy’s Fundamental Gravity.
Financial markets often front run shifts in an economy’s Fundamental Gravity. This means that assets begin exhibiting risk and return characteristics of a specific FG before the economic data confirms this shift.
In the July 23 edition of Gravitational Edge, we reviewed 11 real-time markets that were signaling the arrival of this theme to the U.S. economy. Now, as we’ve turned the page into August, July’s data is beginning to confirm what these markets have been telling us for months.
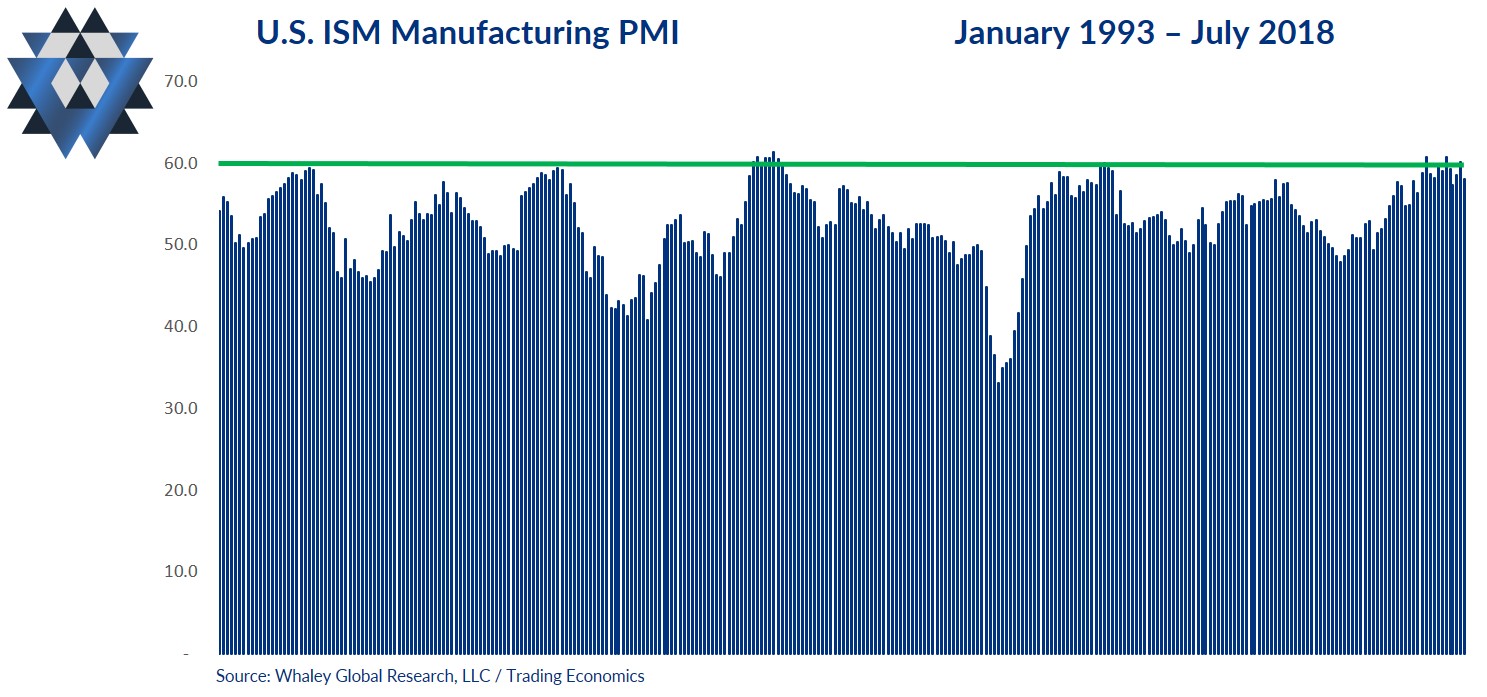
Last week the July reading of the U.S. ISM manufacturing PMI was released, and it came in at an eight-month low at 58.1. While this is still clearly in expansion territory, a breakdown of the survey showed that companies are beginning to struggle against growth headwinds like supply shortages, rising prices and slowing export demand.
The other important aspect of this report is that once again, 60.0 appears to be a resistance level for this index. As our FG chart of the week shows, each time the ISM index has breached the 60.0 level since 1994, a growth-slowing regime has not been far around the corner.
In fact, the index hit 60 on three separate months of the last 11. Each time, it was followed by slowing data. Is July’s slowing data the beginning of a material slowdown in the manufacturing sector, or is it another one-off event? Time will tell, but our evaluation tells us that the peak in manufacturing activity is in the rearview.
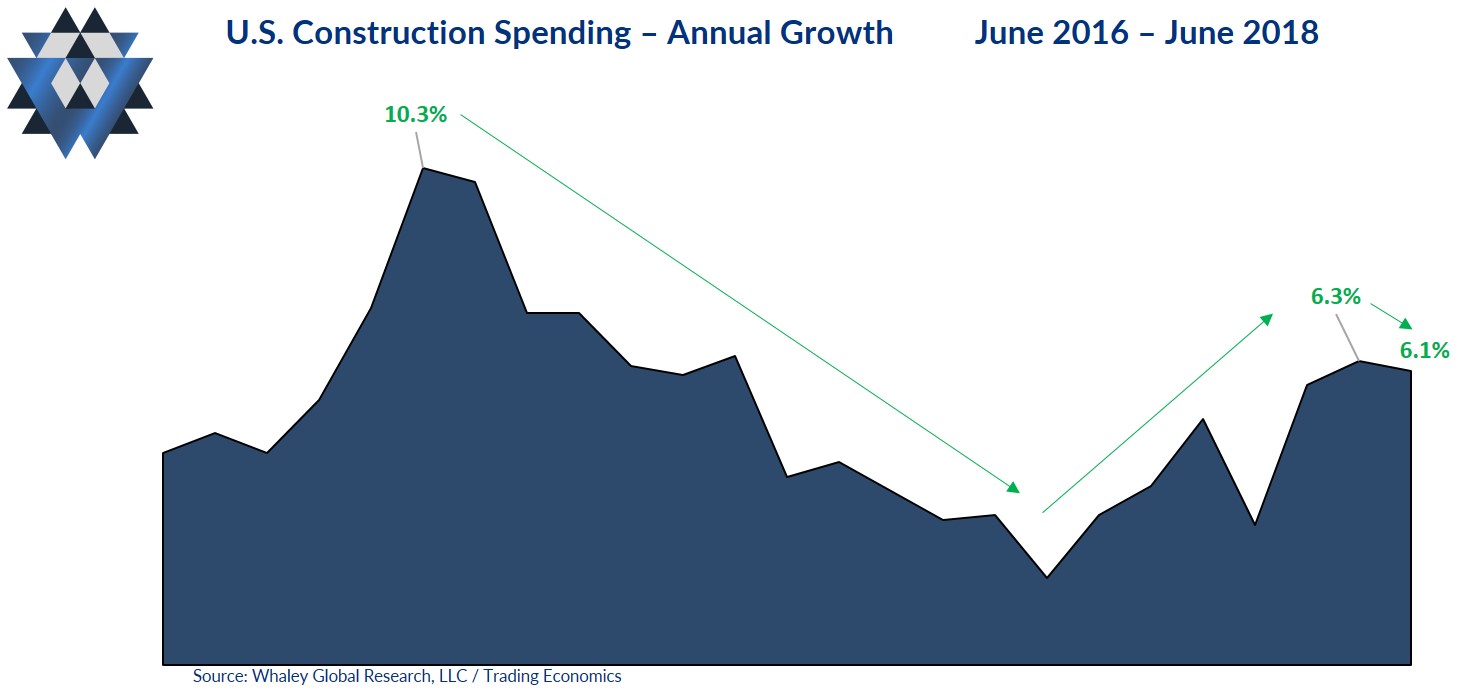
On the housing and commercial side of the economic equation, construction spending has now slowed in two of the last fourth months. The University of Michigan’s July consumer sentiment survey revealed that business outlook has fallen to the lowest level in two years. The New York Fed’s Empire report for July showed that planned capex and spending on technology have fallen to the lowest level in 11 months. And to round it out, the Philly Fed confirmed what’s happening in New York, with its outlook for business activity dropping to the lowest since March 2016.
There are two important economic factors to remember: economic data doesn’t slow across the board all at once, and one data point doesn’t make a trend. However, these few data points we discussed today, coupled with the risk and return profiles we are seeing in U.S.-based financial markets, are enough to convince us that this macro theme is officially active. This means we have our first Fundamental Gravity shift in the U.S. in more than two years.
Fundamental Gravity summary
As more data sets deteriorate, the environment will become more bullish for Utilities SPDR ETF (XLU). In this type of Fundamental Gravity, XLU averages a +4.38% quarterly return with an average drawdown of just -5.14%. It posts positive three-month returns 76% of the time.
The Fundamental Gravity bottom line is that we are witnessing the U.S. Growth a Go-Go theme passing the baton to the U.S. Shift Work macro theme. Asset classes that perform well when U.S. growth slows bottomed between late April and June. Now, starting with the July data, we are starting to see chinks in the U.S. growth armor.
This Friday, August 10, we will release part 2 of this commentary, which is where we will dig in to the other two critical forces, or gravities, that are currently impacting U.S. utilities: Quantitative and Behavioral. We will also provide a detailed game plan for trading XLU from the long side.
If you can’t wait the 48 hours to get the complete picture for this macro theme and the accompanying trade details, please email us at ClientServices@WhaleyGlobalResearch.com with the subject line “U.S. Shift Work.”
We will provide you with the complete macro theme breakdown as well as offer you the opportunity to participate in an eight-week free trial of our research offering, which consists of three weekly reports: Gravitational Edge, The 358, and The Weekender.


