

In part 1 of our commentary, we discussed the current Fundamental Gravity of our “Cry for Me Brazil” macro theme. If you missed part 1, I would encourage you to read through that first, before jumping into part 2 here, writes Landon Whaley.
We covered a great deal of critical fundamental developments, which are bearishly impacting Brazilian equities and the US-listed ETF, the iShares MSCI Brazil ETF (EWZ).
Quantitative Gravity says what?
As a quick reminder, the Quantitative Gravity component of our Gravitational Framework is not technical analysis, which is ineffective and misleading. Rather, we use quantitative measures based on the reality that financial markets are a nonlinear, chaotic system.
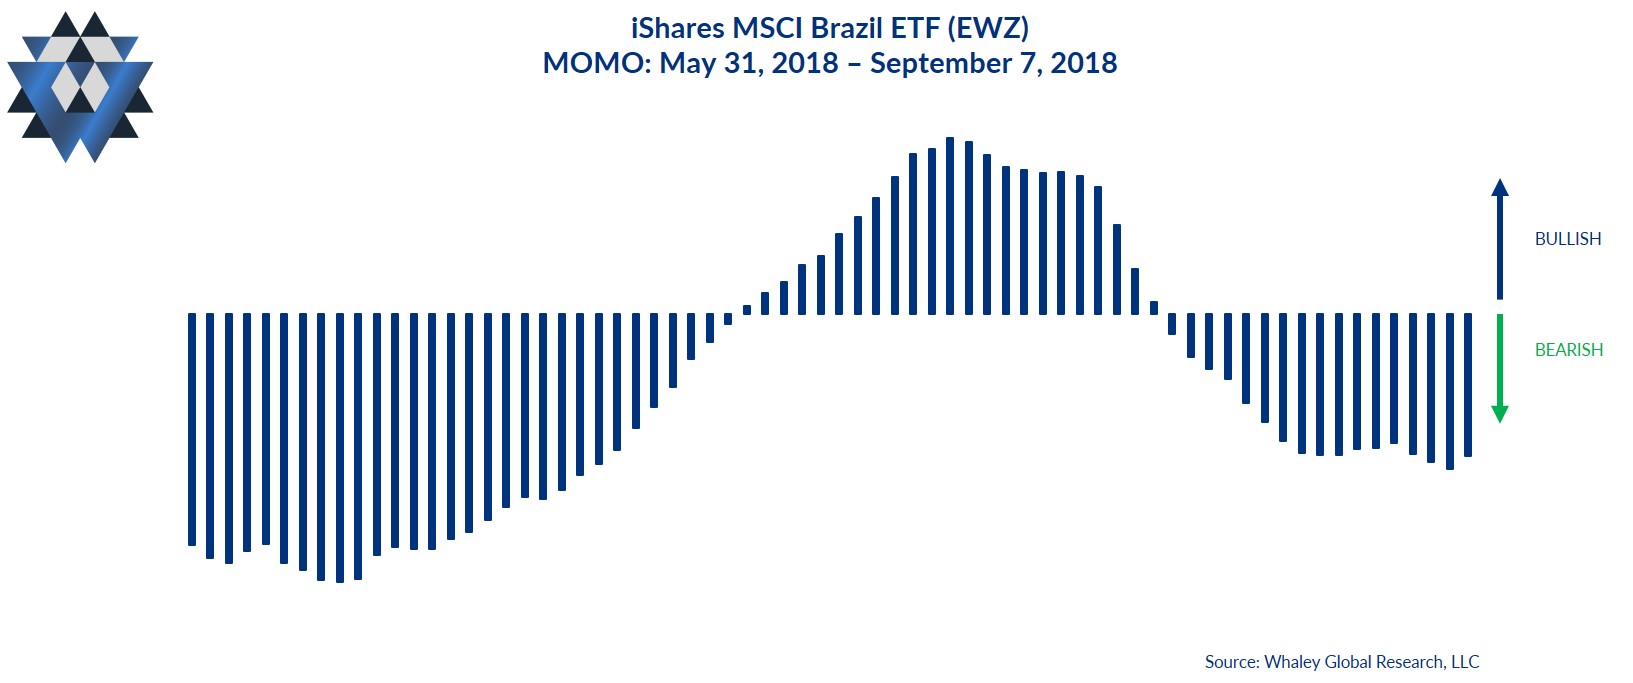
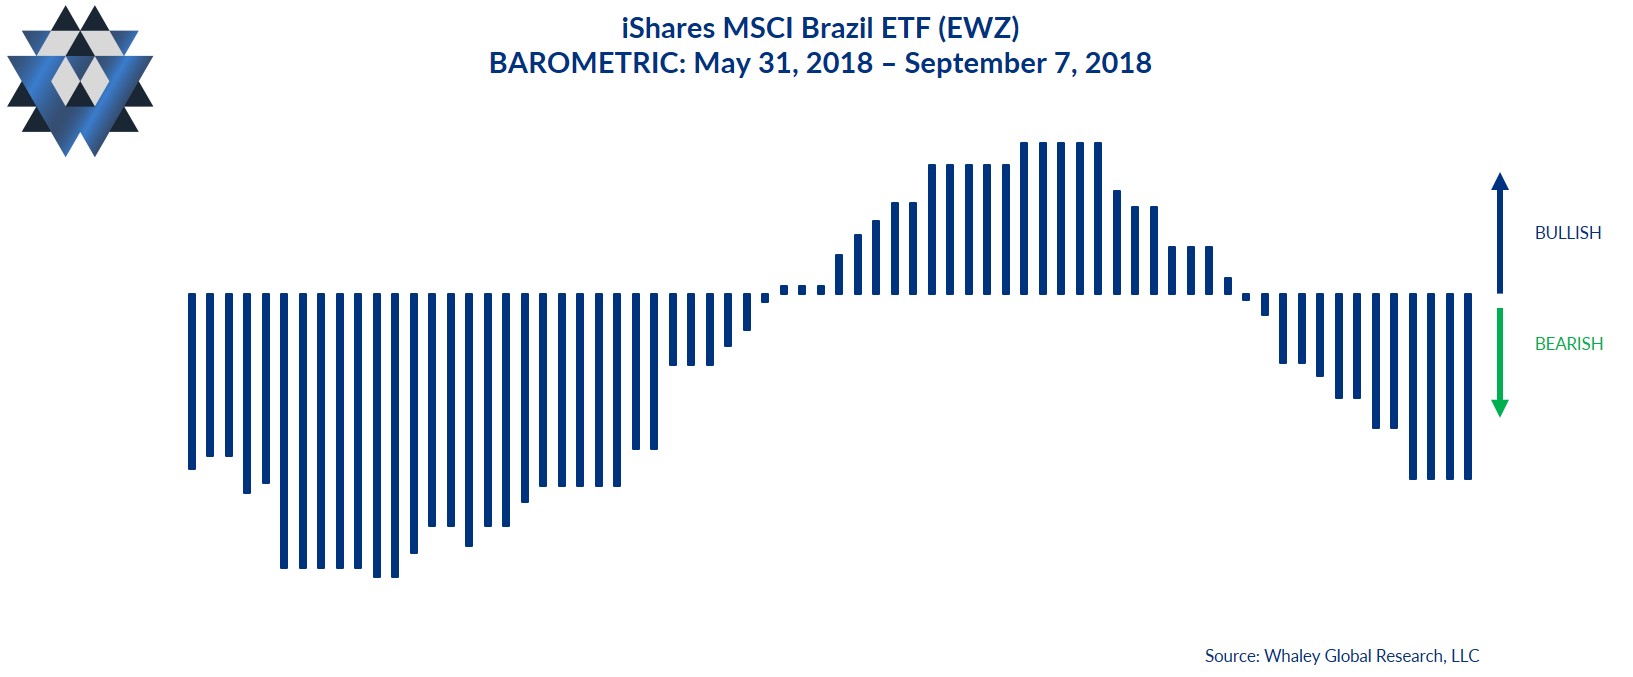
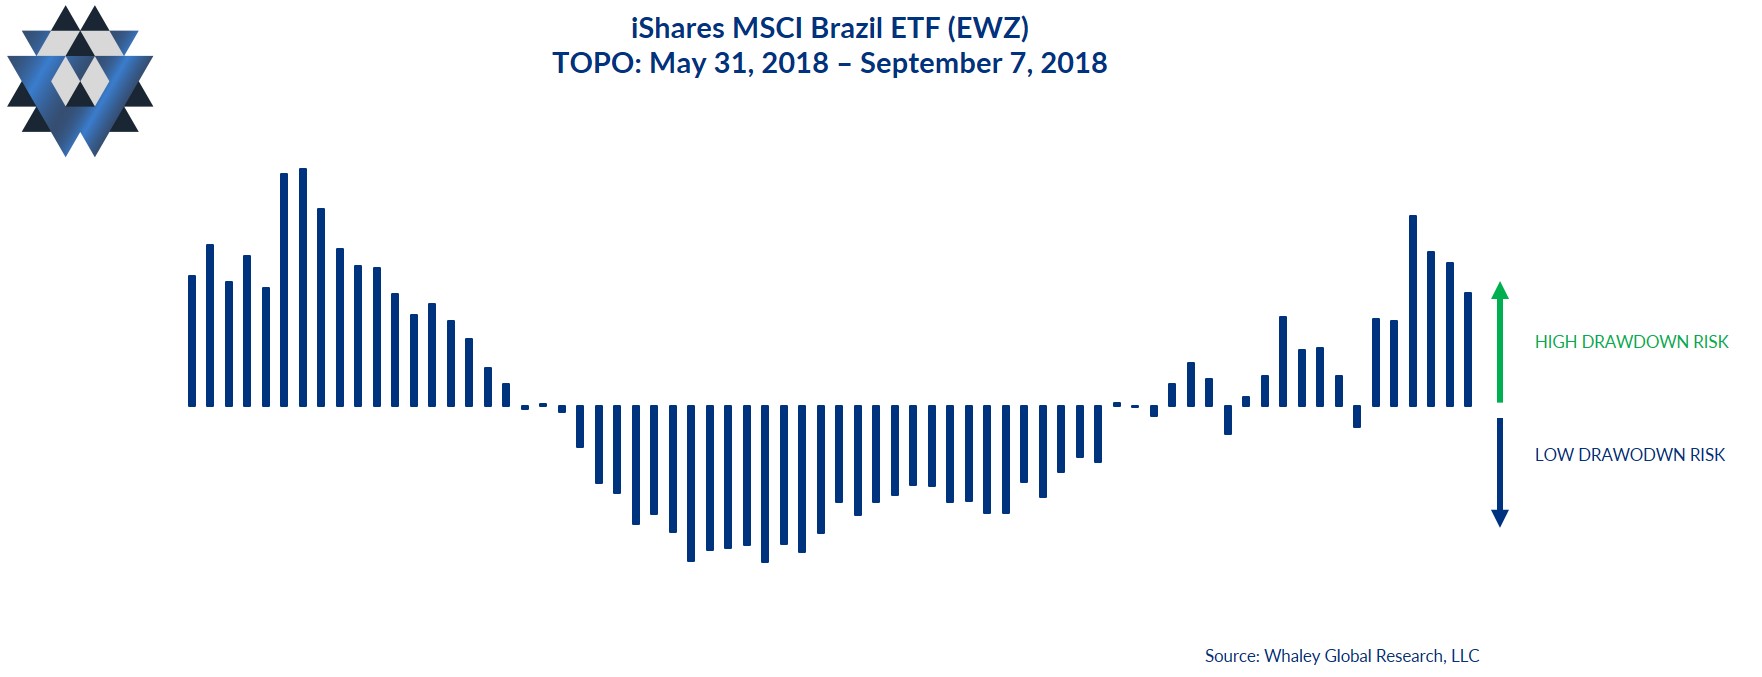
We’ve identified four primary quantitative dimensions of financial markets that affect price movement: energy (trend), force (momentum), rate of force (buying pressure), and a market’s irregularity (level of imminent drawdown risk).
Social is our measure of a market’s current energy (or trend). EWZ’s Social reading indicates it remains firmly in hangover mode, which is where it’s been since March 12. Given the Fundamental Gravity, this bear market in Brazilian equities will get deeper before it even thinks of turning bullish.
Momo is our measure of the amount of force behind the market’s current state. EWZ’s Momo has spent most of 2018 solidly in bearish territory and that is where it remains. In addition, we’ve seen a new building of bearish force on this most recent price bounce from September 5.
Barometric is our measure of buying and selling pressure or the rate of force behind the current Momo. EWZ’s Barometric indicates sellers remain firmly in control of this market and won’t cede control any time soon.
Topo, which measures the probability of a drawdown, is indicating an extremely high level of drawdown risk for EWZ over the next 10 trading days. For most of July and August, Topo was saying the risk of a drawdown was low. At the margin, this type of shift in Topo is extremely bearish.
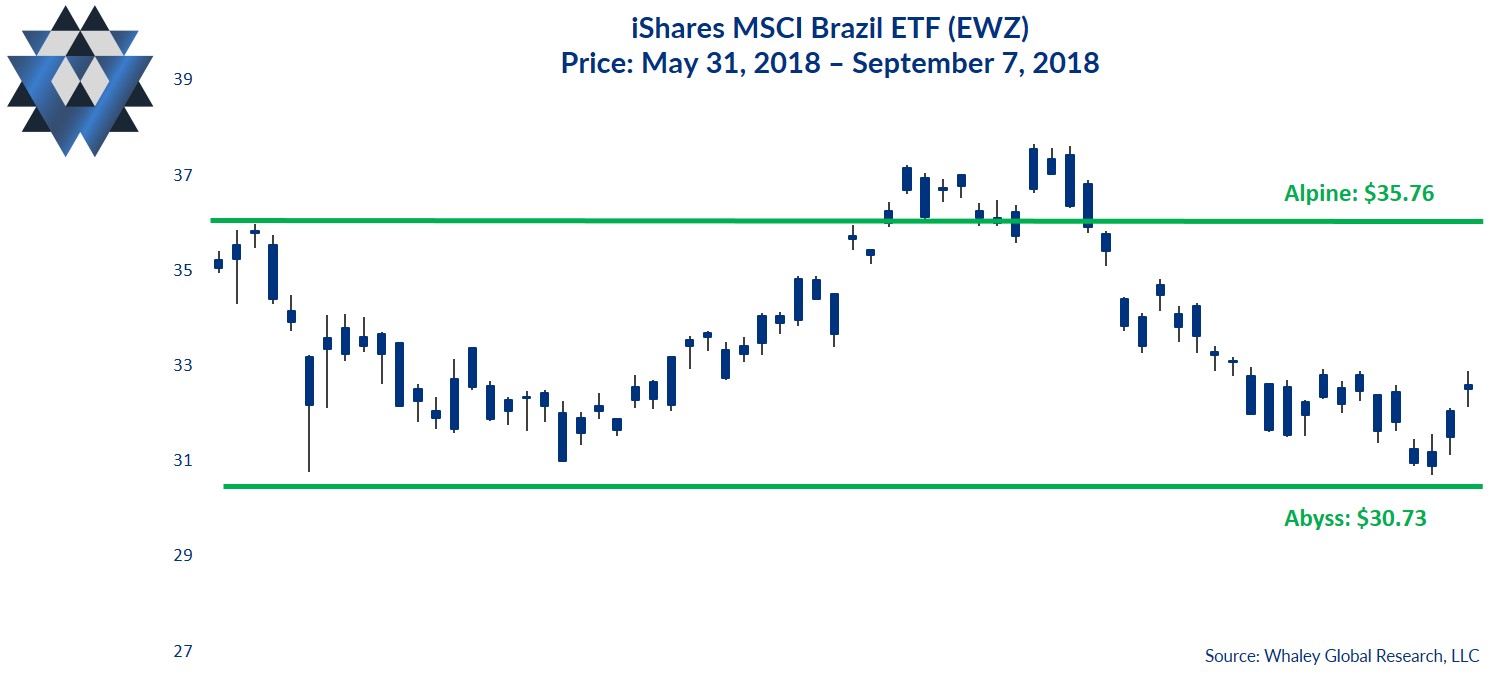
Alpine and Abyss Lines
Our proprietary Alpine and Abyss lines are not “support” and “resistance.” Rather, they are the areas above and below the most recent closing price where price is likely to experience an acceleration in its current trajectory, or a possible reversal of its current course. We calculate these critical prices utilizing fractal geometry and Chaos Theory as the foundation to analyze the underlying market structure, which is not visible on a price chart.
When a particular market’s price interacts with the Alpine or Abyss areas, regardless of whether the price is rejected by the Alpine or Abyss area or is able to breakout above (or breakdown below) it, the outcome gives you critical insight into the most likely direction of that market.
The most critical Alpine area for EWZ above Friday’s closing price is between $35.41 and $36.29. This means that it’s highly likely that any upside price momentum will stall at this area. However, if EWZ closes decisively above that area, price is likely to accelerate higher from there.
The most critical Abyss area for EWZ below Friday’s closing price is between $30.84 and $30.35. This means that it’s highly likely that any downside price momentum will stall at this area. However, if EWZ closes decisively below that area, price is likely to accelerate downward from there.
The Quantitative Gravity bottom line is that all factors for EWZ remain extremely bearish. When shorting a bear market as entrenched as Brazilian equities are currently, it’s critical that you risk manage the inevitable dead cat bounces.
Behavioral Gravity says what?
Behavioral Gravity allows us to evaluate investors’ perception of this market and how that perception changes and shifts over time.
The Behavioral Gravity Index for EWZ has been extremely bearish for several months now, as investors exited longs and got short. Notably, they did so after the market crashes.
Investors yanked $710MM from EWZ during August, creating the largest monthly outflow in the ETF’s 18-year history. EWZ hasn’t seen a day of inflows since June 18! The bearish sentiment, although six months too late, is definitely warranted.
The behavioral bottom line is that EWZ’s Behavioral Gravity Index is extremely bearish right now, and this raises the risk of initiating or holding short positions. This behavioral reality doesn’t stop us from shorting EWZ, but it’s just one more risk that needs to be managed.
The Trade Idea
As long as EWZ trades below $35.76, new short trade ideas can be initiated opportunistically on rallies. Depending on your entry and how much room you want to give this trade idea to move, use a risk price between $33.56 and $35.76. That said, your risk price line in the sand is $35.76. If EWZ closes above that price, exit any open trades. If the trade moves in your favor and EWZ trades down to the $30.73 area, consider closing some, or all, of your position.
In addition to providing detailed analysis and trade ideas like this commentary on a weekly basis, we also provide real-time email alerts whenever we add, or close, a position in our Asset Allocation model inside our Gravitational Edge report.
We are currently out of EWZ in our Asset Allocation Model and will send out an alert if we get the right entry price that skews the reward-to-risk characteristics of the short trade in our favor.
Please click here and sign up if you’d like to receive an email alert when we initiate our position in this market and to participate in a an eight-week free trial of our research offering, which consists of three weekly reports: Gravitational Edge, The 358, and The Weekender.


