

The QuantCycle Oscillator is indicating that natural gas could be ready to reverse its recent bearish trend.
Last week natural gas set a triple bottom based on a monthly chart—a quintuple bottom based on the weekly chart— (see chart below), and is currently challenging a 30-month low.
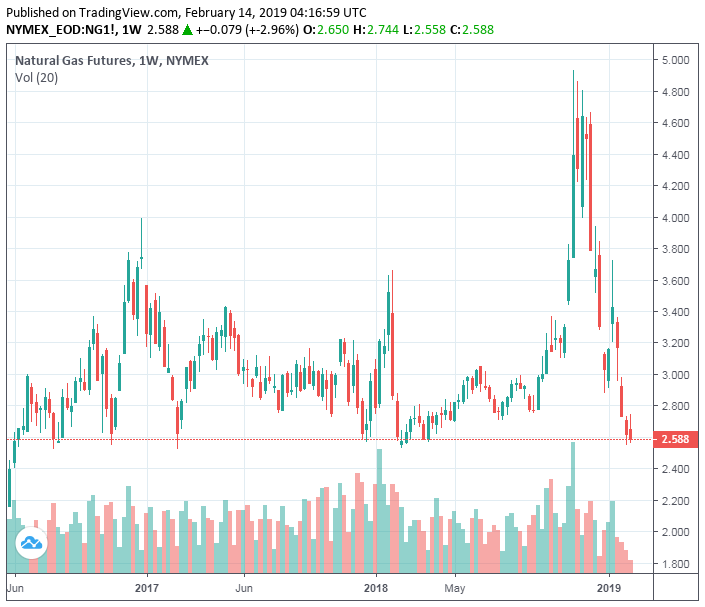
The weekly gas chart shows that there is strong support just above the $2.50 per MMBtu level where it has bounced off of several times in the last 30 months.
More importantly the long-term weekly QuantCycle Indicator shows that the natural gas market is at a significant turning point.
Natural gas moved into extreme oversold territory around the first of the year. However, the long-term QuantCycle oscillator had natural gas in a downward cycle. Over the last week, natural gas has made new lows for the year just as the QuantCycle Oscillator is turning up (see chart). This is an extremely bullish indicator.
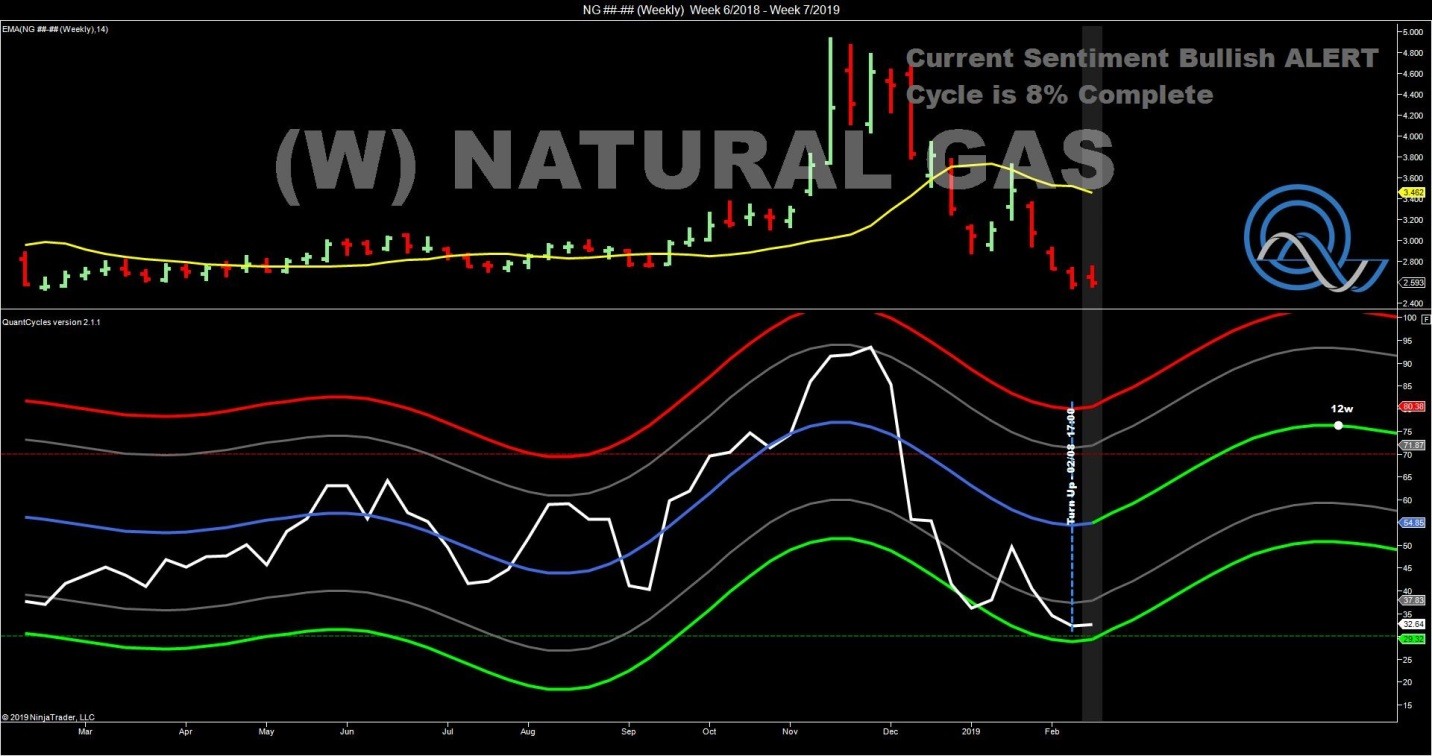
Natural gas has dropped nearly 50% in a short period of time and is sitting at a triple bottom on a monthly chart, in extreme oversold territory just as the QuantCycle is turning higher.
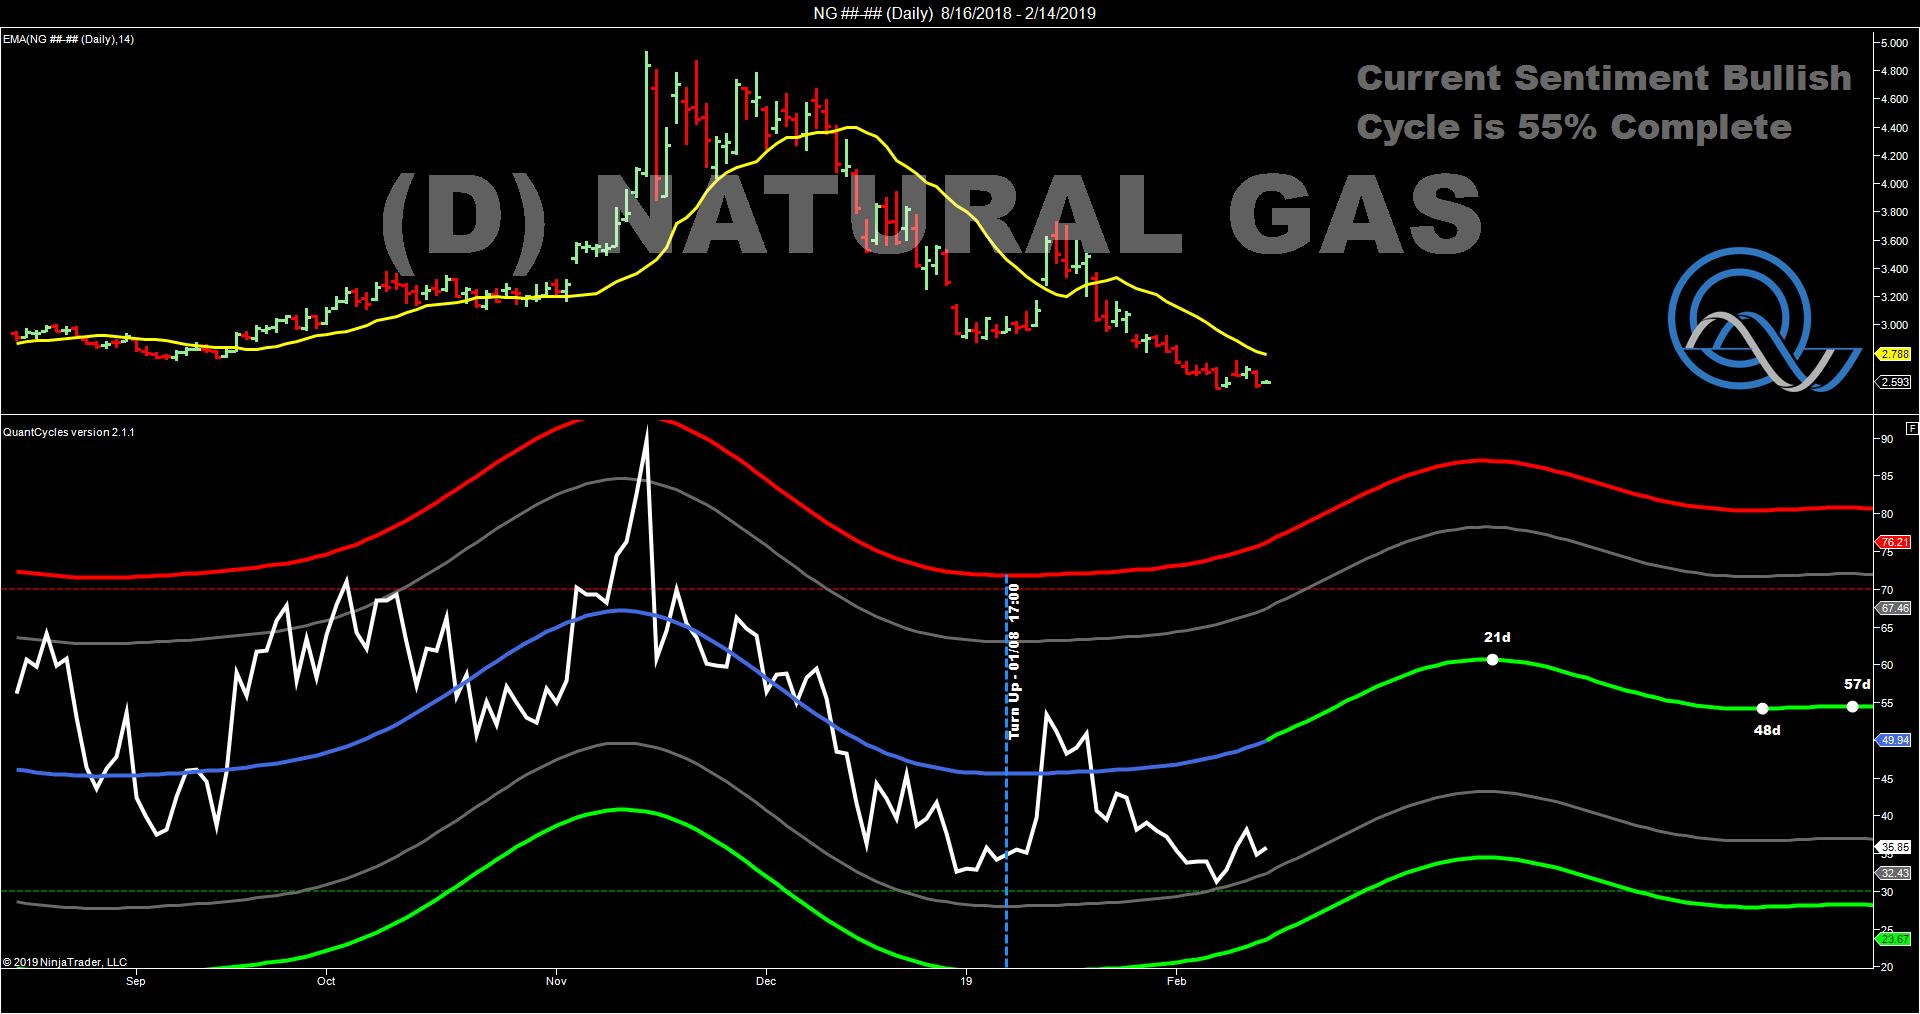
A look at the daily chart confirms the upward bias, though it is not in as extreme of an oversold condition as the weekly oscillator shows.
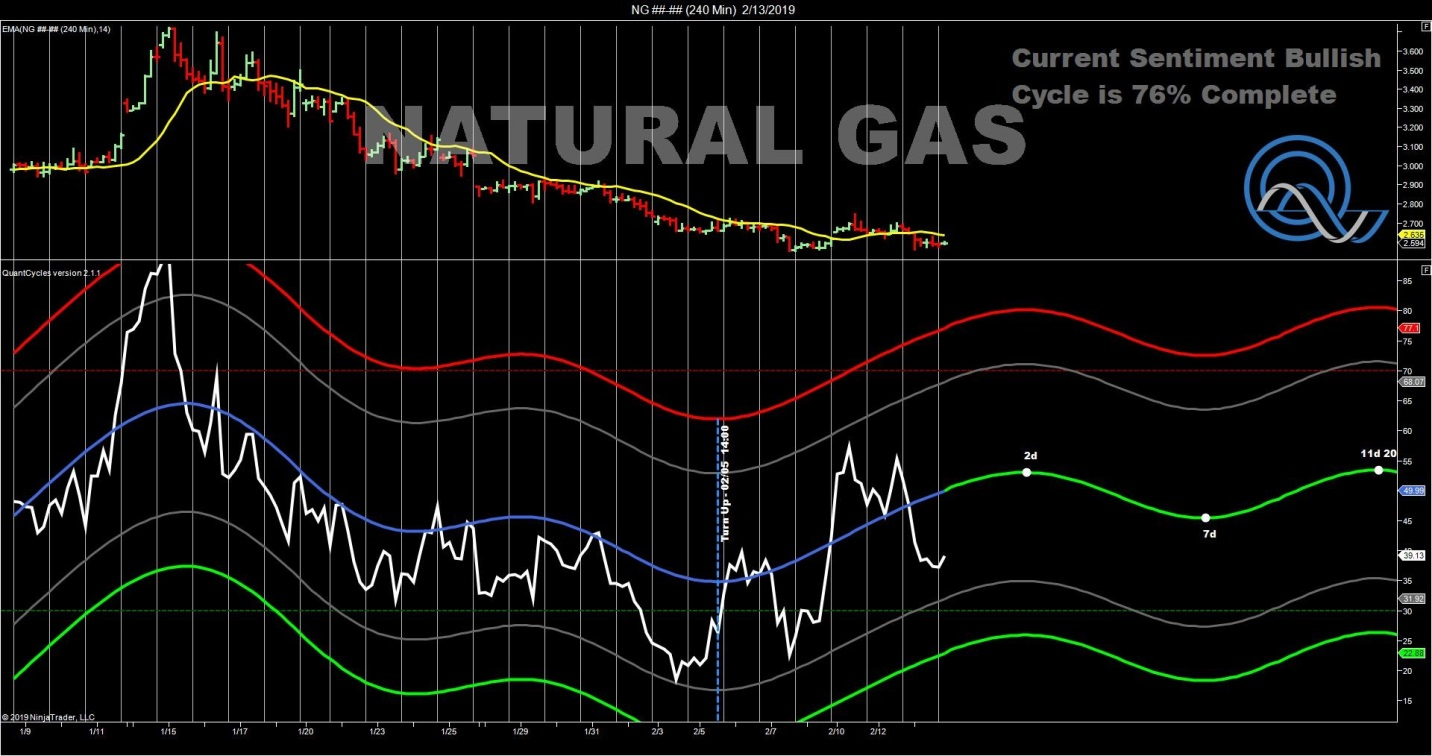
Breaking it down further in a shorter-term timeframe, the 240-minute chart also confirms that natural gas is in an uptrend. The shorter-term chart indicates that there may be multiple opportunities to get long natural gas. However, looking at where the market is—testing a multi-year support area— and it probably is not wise to wait. Especially if you are trading from a longer-term perspective. The long-term chart suggests that the bull move in gas couldchallenge the 2018 highs near $5 over the next three months.
If you are a short-term trader you could wait, or attempt to take short-term profits at the end of the week and then wait for another opportunity to get long.
Of course there is the possibility that long-term support is take out, but at $2.50, you probably don’t want to miss this opportunity.
The QuantCycle indicator is a technical tool that employs proprietary statistical techniques and complex algorithms to filter multiple cycles from historical data, combines them to obtain cyclical information from price data and then gives a graphical representation of their predictive behavior (center line forecast). Other proprietary frequency techniques are then employed to obtain the cycles embedded in the prices. The upper and lower bands of the oscillator represent a two-standard deviation move from the predictive price band and are indicative of extreme overbought/oversold conditions.


