

While the S&P 500 has been toying with their all-time highs, CSCO erased all of its Q4 2018 losses by Valentine’s Day, writes John Rawlins.
The Technology sector has generally outperformed the broader market in recent years and during the rebound from the fourth quarter 2018 sell-off. Look no further than technology giant Cisco Systems (CSCO) for proof.
While the S&P 500 has been toying with their all-time highs, CSCO erased all of its Q4 2018 losses by Valentine’s Day and has still been moving higher.
That was roughly the time that the QuantCycle Oscillator turned lower on by the weekly and daily chart.
More precisely, the daily QuantCycle turned down on Feb. 11 and the weekly turned down on Feb. 22.
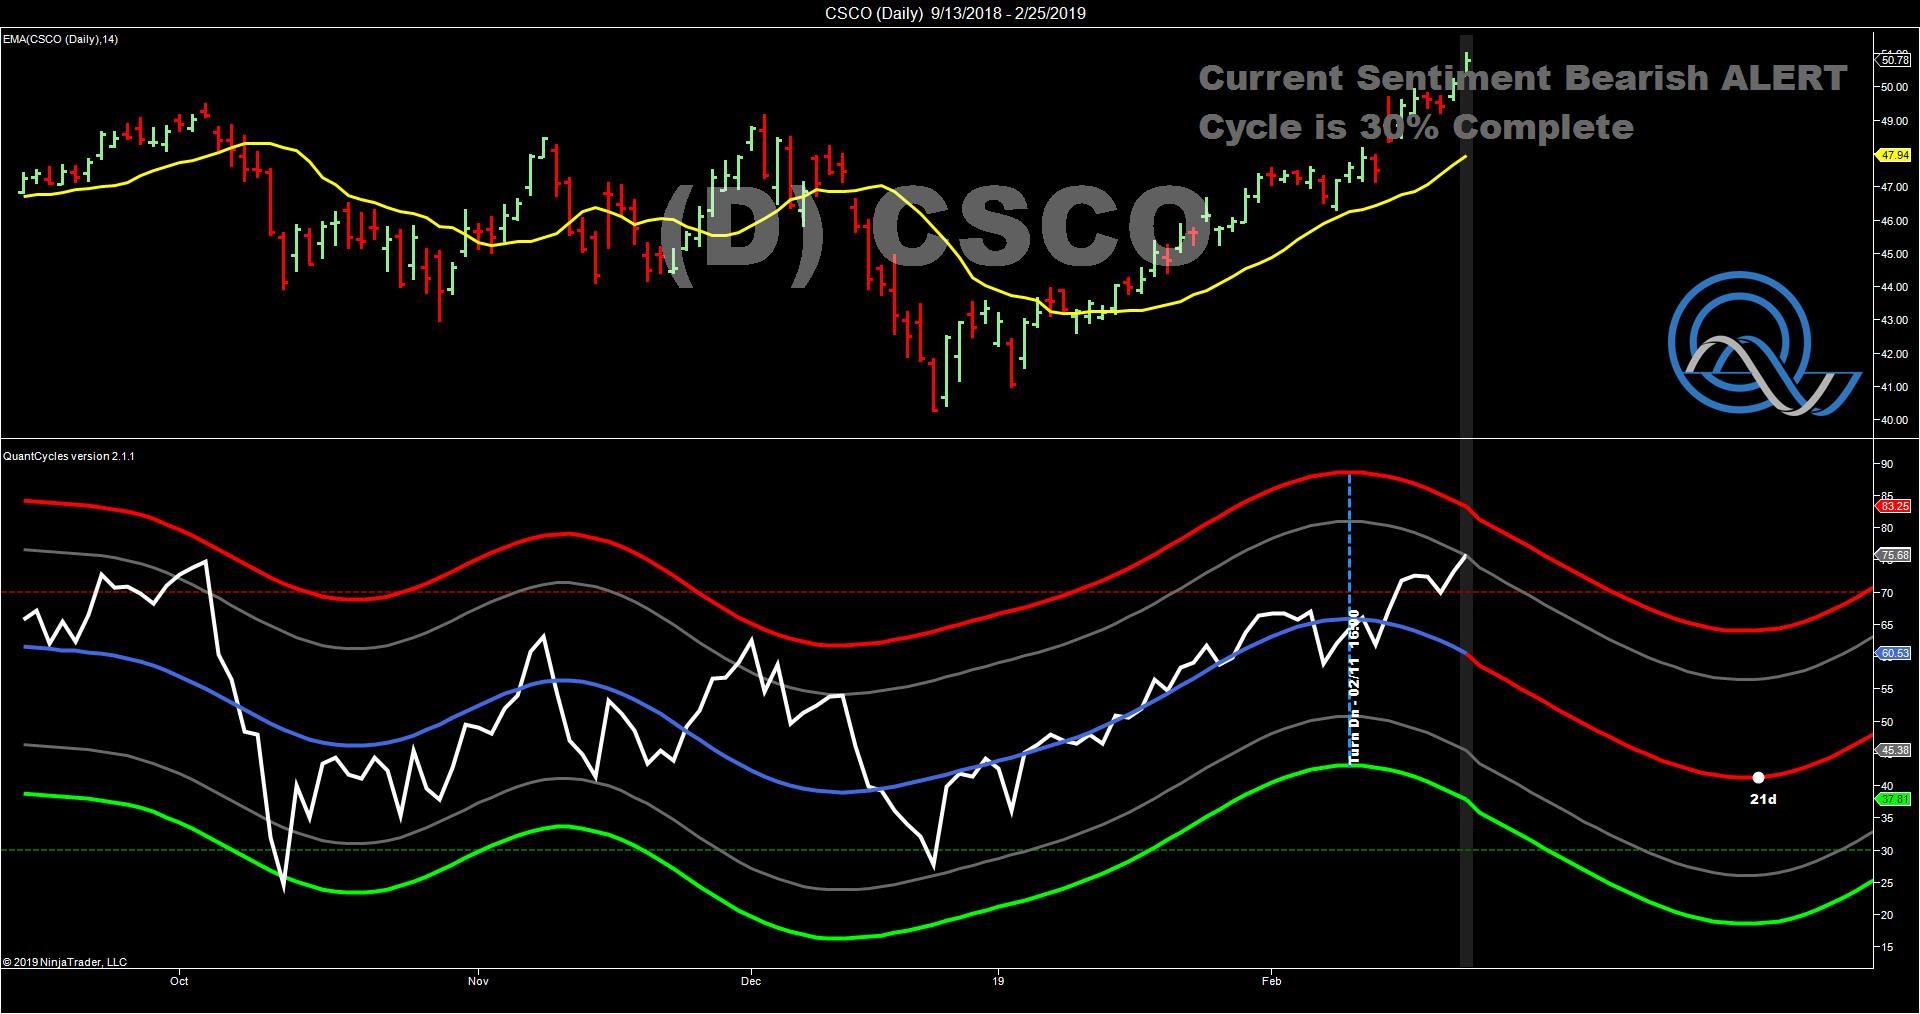
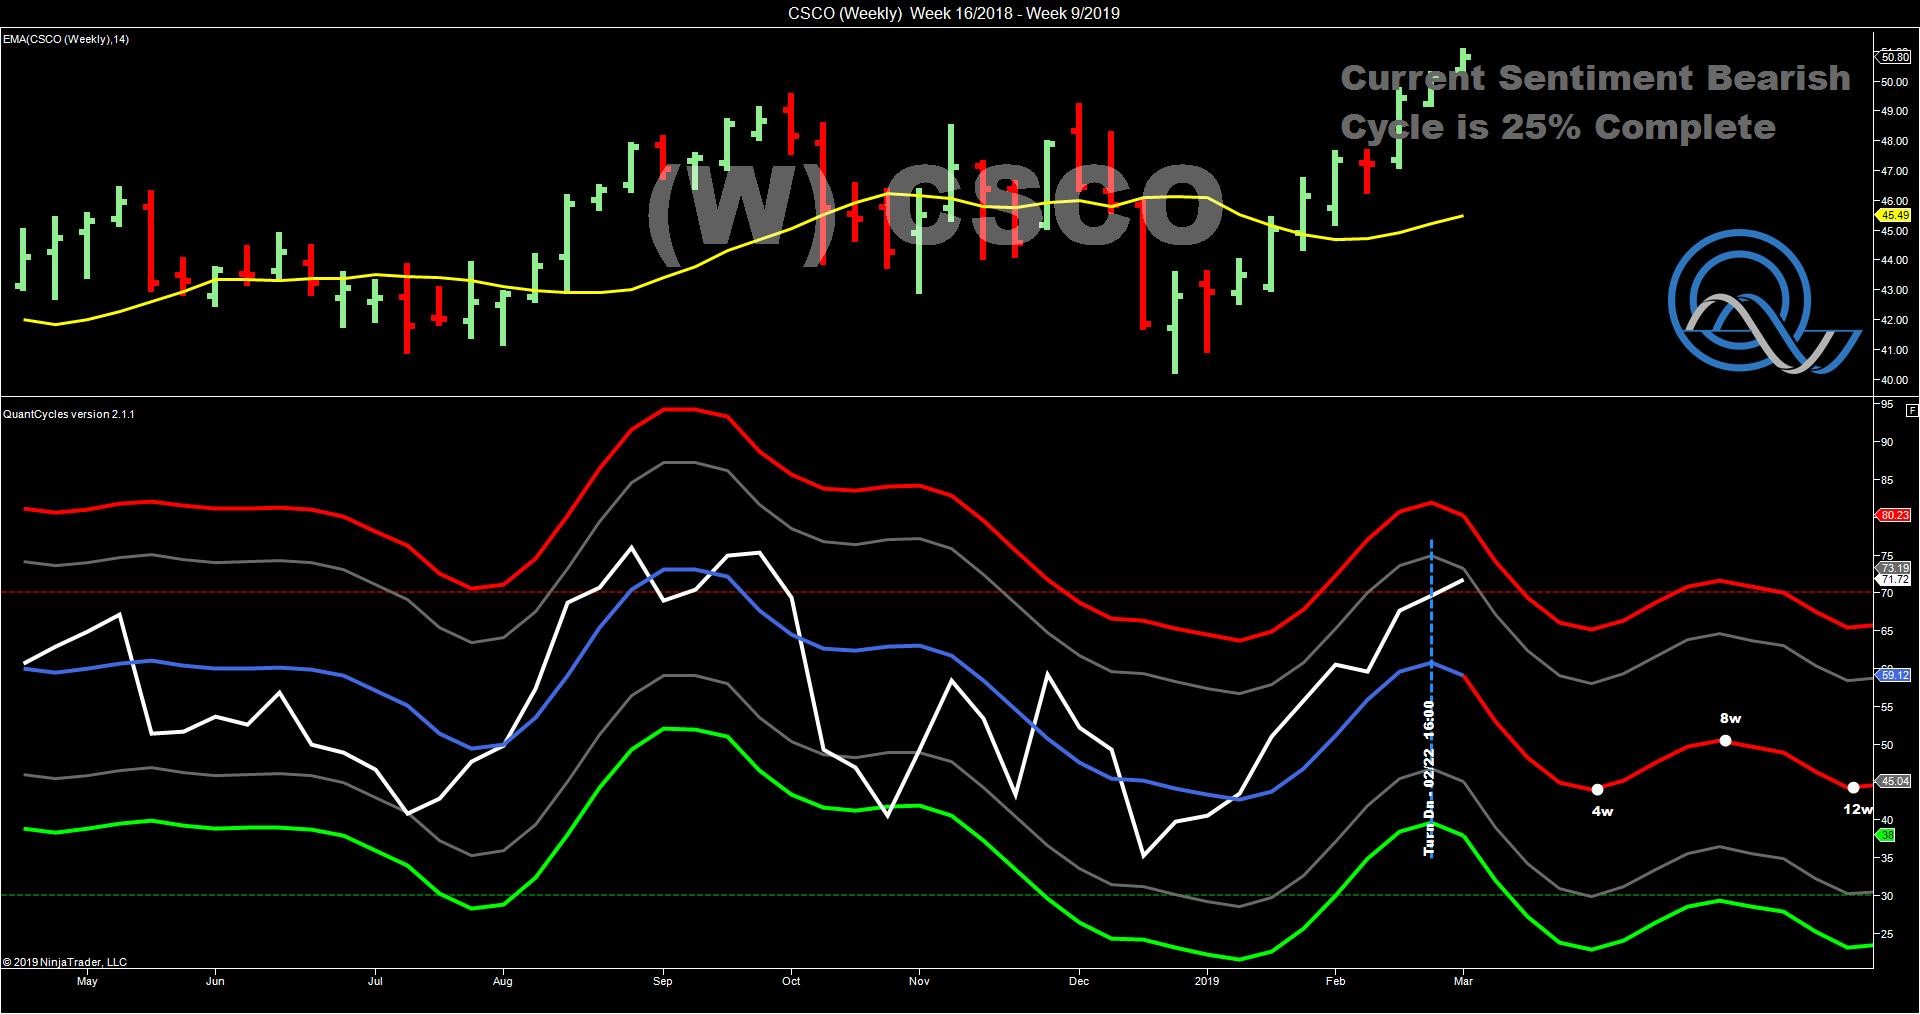
The continuing strength of Cisco pushed both charts near overbought territory, and both show the stock moving lower for the next four weeks. There is a strong correlation between the daily and weekly charts, which makes the signal stronger.
The overall weakness and timeframe matches our broader analysis on market volatility from yesterday. The QuantCycle is indicating a strong sell on CSCO.
Rawlins described the value of the QuantCycle Oscillator recently at the Orlando MoneyShow.
The QuantCycle indicator is a technical tool that employs proprietary statistical techniques and complex algorithms to filter multiple cycles from historical data, combines them to obtain cyclical information from price data and then gives a graphical representation of their predictive behavior (center line forecast). Other proprietary frequency techniques are then employed to obtain the cycles embedded in the prices. The upper and lower bands of the oscillator represent a two-standard deviation move from the predictive price band and are indicative of extreme overbought/oversold conditions.


