

The QuantCycles Oscillator is flashing a buy for OXY, reports John Rawlins.
A relatively rare confluence of multiple timeframes in the QuantCycles Oscillator occurred yesterday in Occidental Petroleum Corporation (OXY).
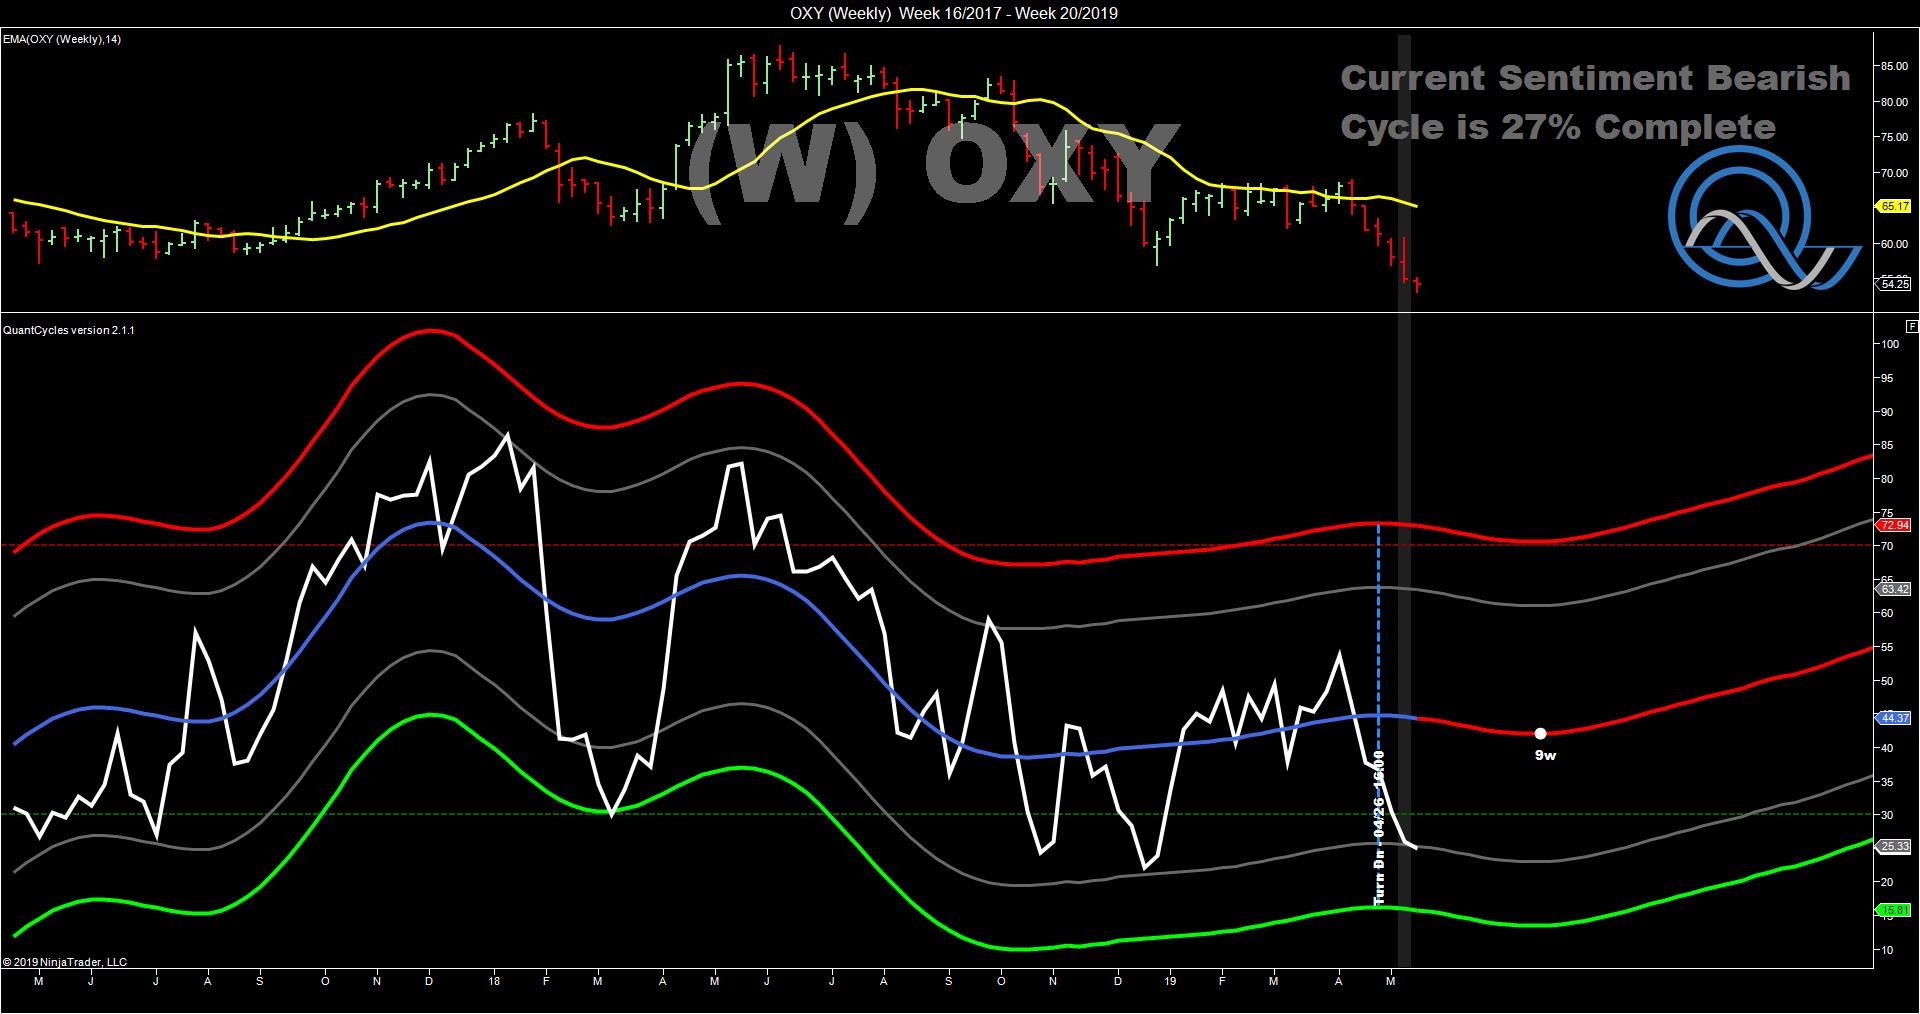
Wednesday we had a 120-minute, 240-minute, daily and weekly extreme on OXY. The weekly is not pointing up, but it is very oversold (see chart).
The 120-minute, 240-minute and daily are really strong buy signals. There was a nice divergence and a reversal yesterday. OXY rose to $54.25 from a Wednesday low at $53.12. This kind of setup indicates a bounce to $59.00 to $62.00 (see charts).
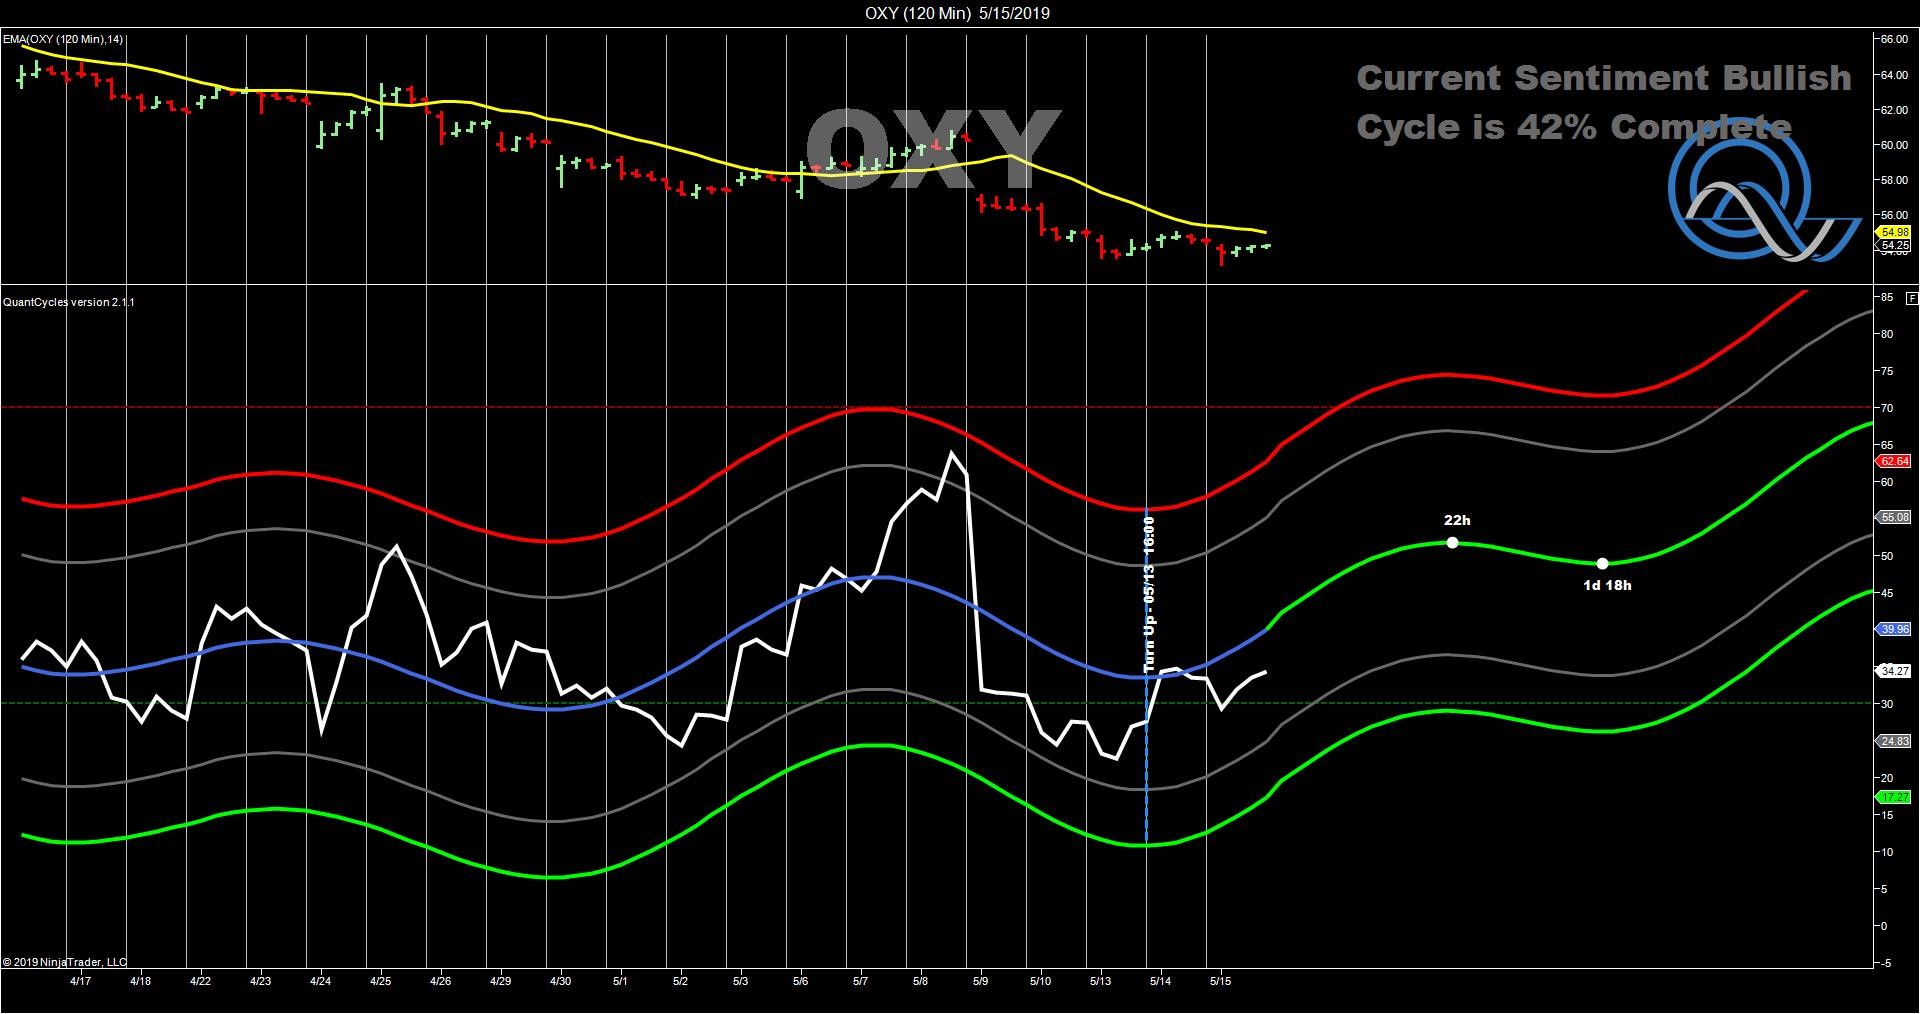
120-minute
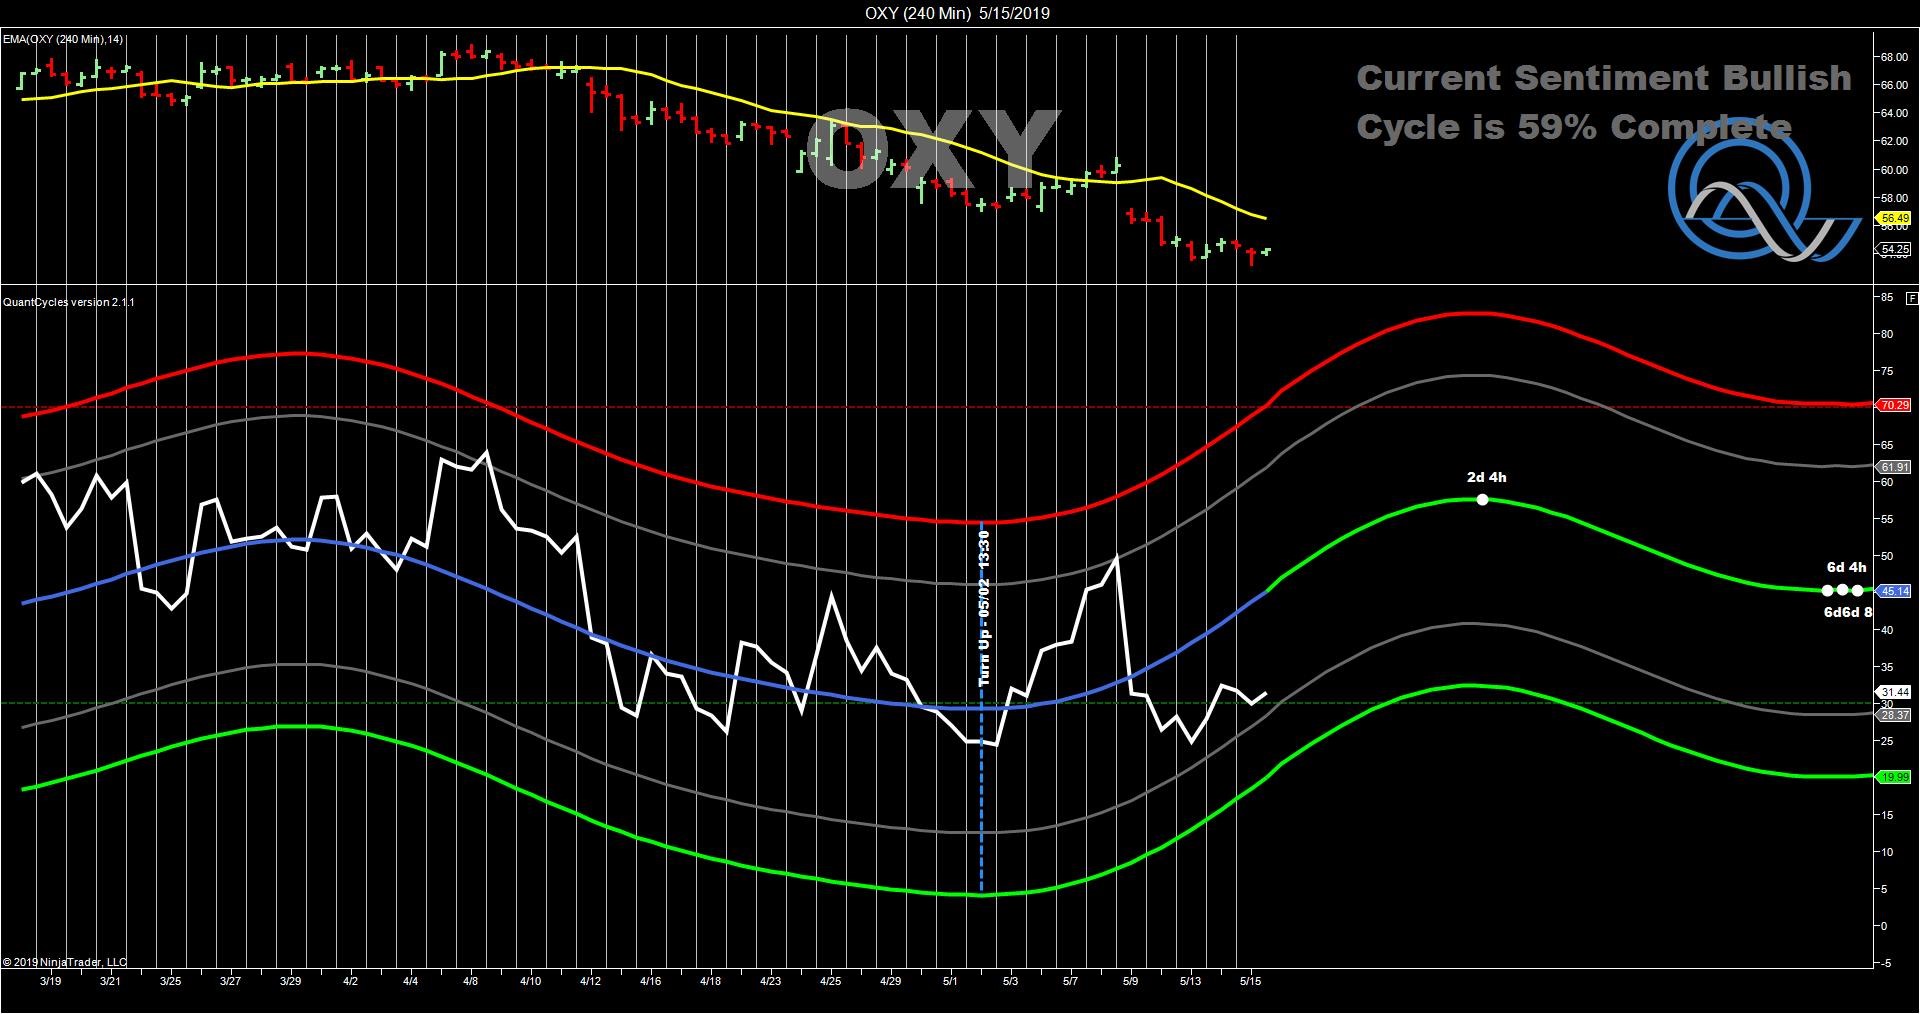
240-minute
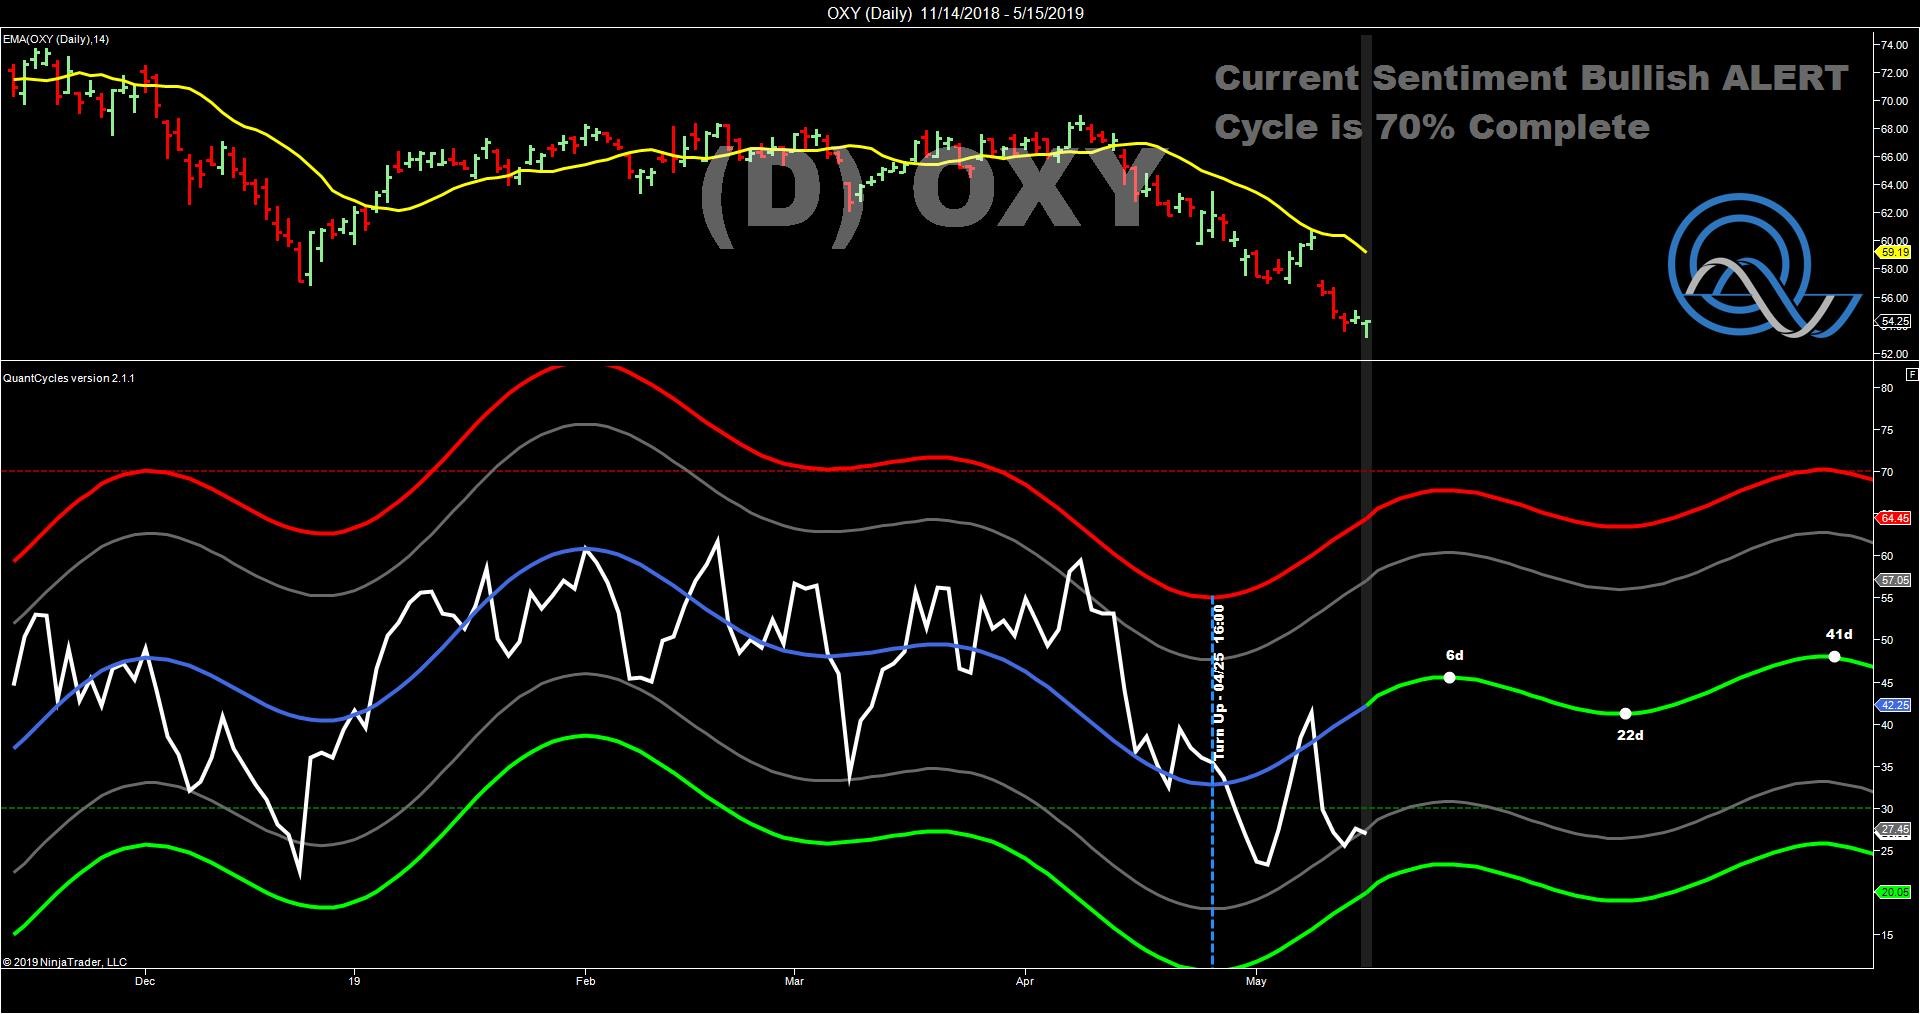
Daily
John Rawlins described the value of the QuantCycles Oscillator recently at The Orlando MoneyShow.
The QuantCycles indicator is a technical tool that employs proprietary statistical techniques and complex algorithms to filter multiple cycles from historical data, combines them to obtain cyclical information from price data and then gives a graphical representation of their predictive behavior (center line forecast). Other proprietary frequency techniques are then employed to obtain the cycles embedded in the prices. The upper and lower bands of the oscillator represent a two-standard deviation move from the predictive price band and are indicative of extreme overbought/oversold conditions.


