

Friday’s crude oil price action maybe the start of a second corrective leg down, writes Al Brooks.
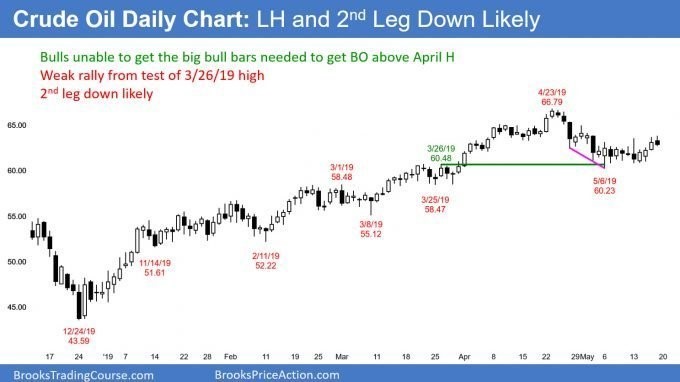
Crude oil has gone mostly sideways for two weeks after a buy climax. There will probably be a second leg down. The March 1 high of $58.48 is a breakout point and therefore a strong magnet.
The crude oil weekly futures chart reversed down from a buy climax three weeks ago. The trend accelerated up six weeks ago and the bulls used the rally to take their surprisingly big profit (see chart).
Every bar since then has had prominent tails. That means that there were reversals up and down on the daily chart. Multiple reversals mean a lack of conviction. That is typical trading range price action. There is no sign that it is about to end. Consequently, traders should expect mostly sideways price action for at least a couple more weeks.
When a buy climax reverses, there will typically be at least two legs sideways to down. The reversal is caused by the bulls taking profits. They do not take profits in a prolonged bull trend if they intend to buy again a few bars later. They take profits because they think the pullback might be deep and last a long time.
Traders should expect at least a couple legs sideways to down. If the bears twice fail to create a bear trend, the bulls will begin to buy again. There has only been one leg down. Therefore, the odds favor a lower high and then a second leg down. Friday might have been the start of the second leg down.
However, the pullback (bounce up) from the first leg down usually retraces more than half of the first leg down. Consequently, the rally might continue up to $65 before the second leg down begins.
Where will the bulls buy again?
Th March 25 low was a breakout test of the March 1 high. Also, the April 22 high was about a measured move up from the Jan. 14 low to the March 1 high. Traders therefore believe that the March 1 high of $58.48 is an important price. That makes it a reasonable target for a second leg down over the next couple months.
Can the bull trend resume without a second leg down? Yes, but at the moment, the two-week rally looks like a leg in a trading range and not a resumption of the bull trend. It therefore will probably lead to a lower high. Traders then have to be looking for targets below, like the March 1 breakout point.
Traders can see the end of the day bar-by-bar price action report by signing up for free at BrooksPriceAction.com. I talk about the detailed E-mini price action real-time throughout the day in the BrooksPriceAction.com trading room. We offer a two-day free trial.


