

The QuantCycles Oscillator is anticipating a turn on long-term bond yields, says John Rawlins.
While most market analysts accept the notion that the massive 35+ year bull market in long-term bonds had peaked a couple of years ago, long-term bonds have been rallying of late, and the move was so epic that there really hasn’t been technical proof of a trend change.
The 30-year bond has been strong of late —causing rates to drop and test its 2018 support level.
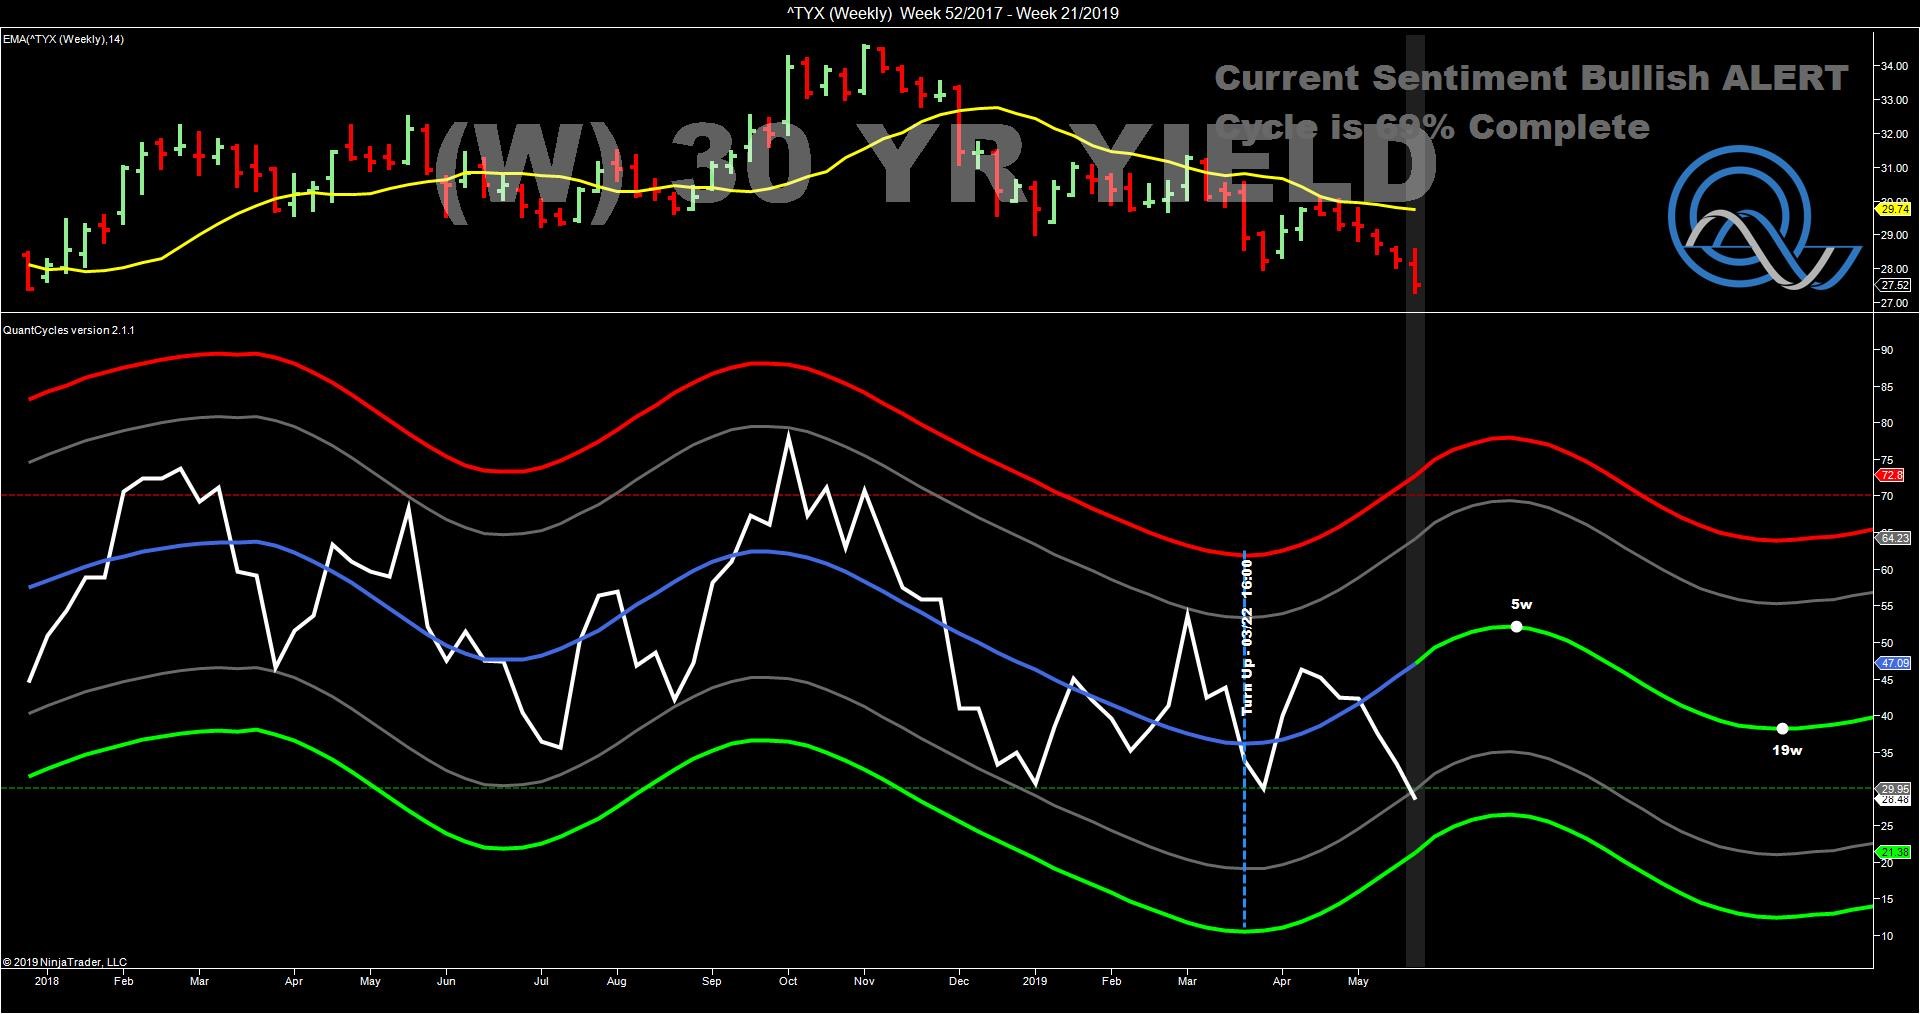
The QuantCycles Oscillator of the yield on long bonds (yields move inverse of price) shows yields are close to oversold territory.
The weekly oscillator turned positive in March, but after a brief rally, began losing ground in April. This pushed it near oversold territory with the uptrend expected to continue for five weeks (see chart).
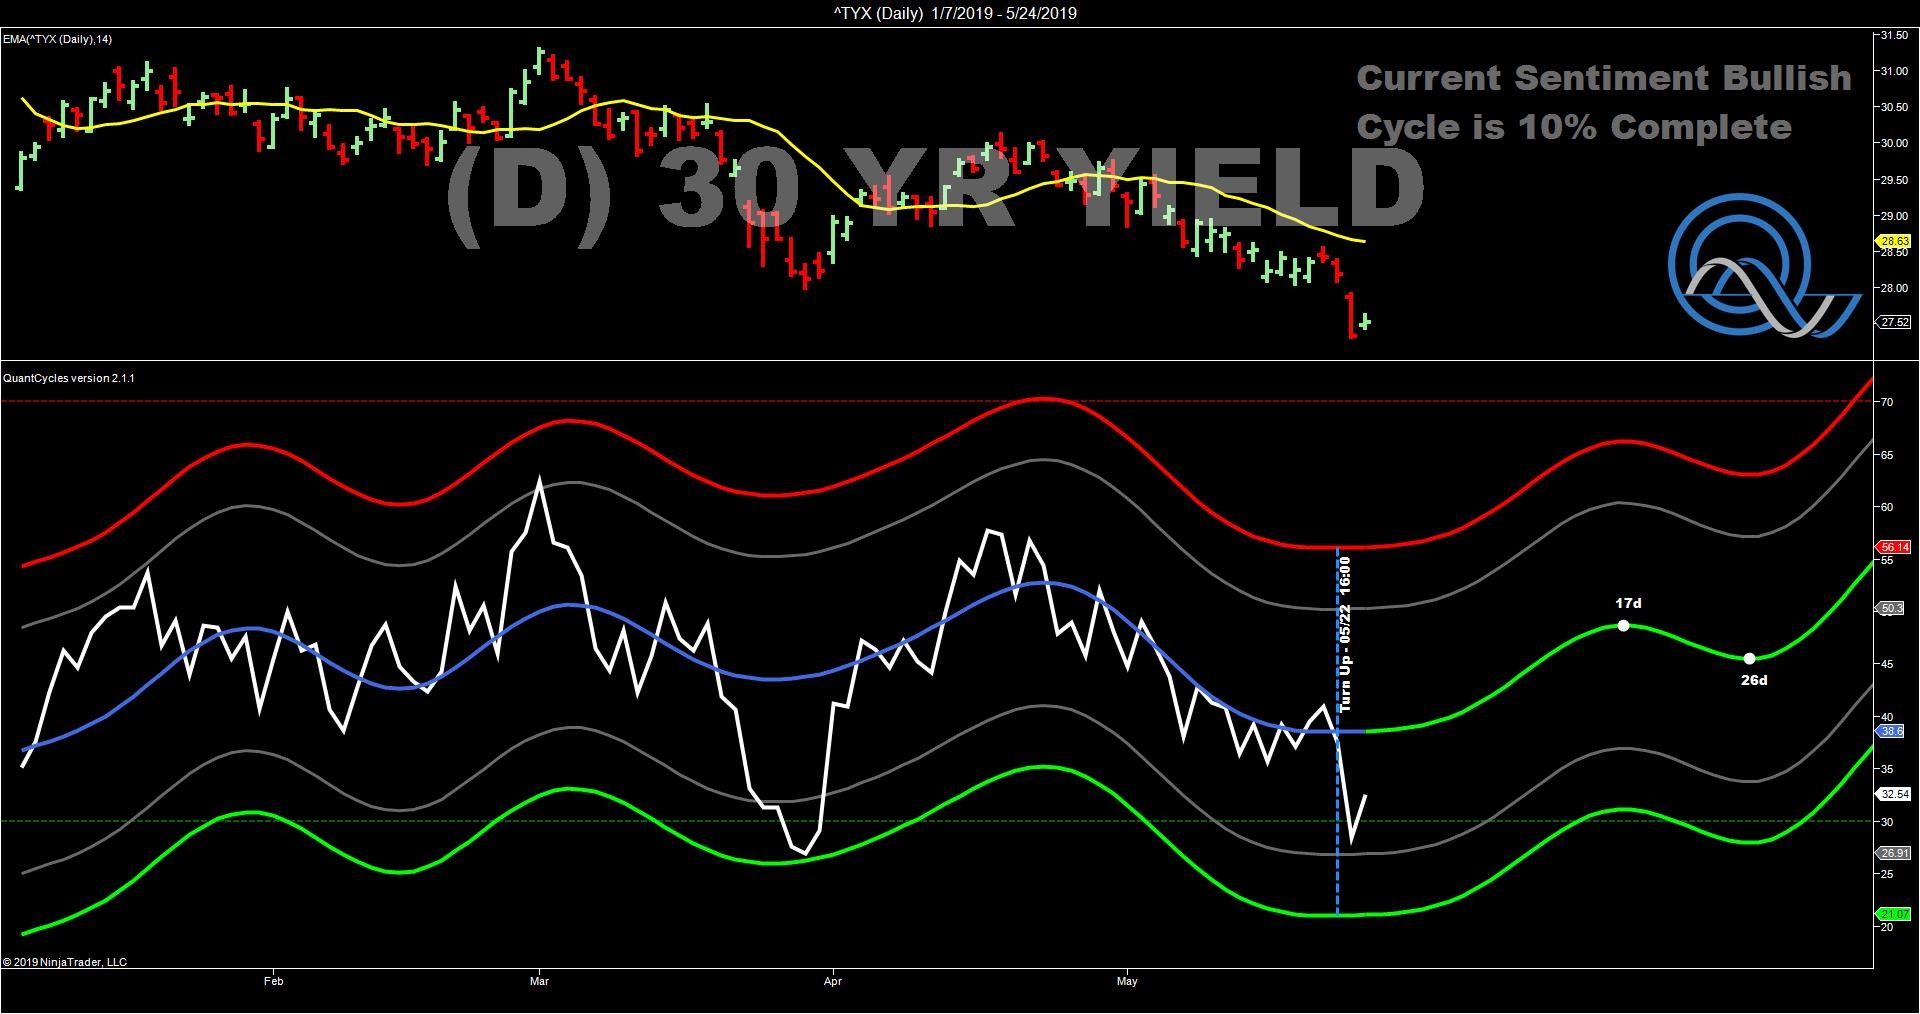
The daily yield chart on the 30-year just recently turned positive and is also near oversold territory (see chart).
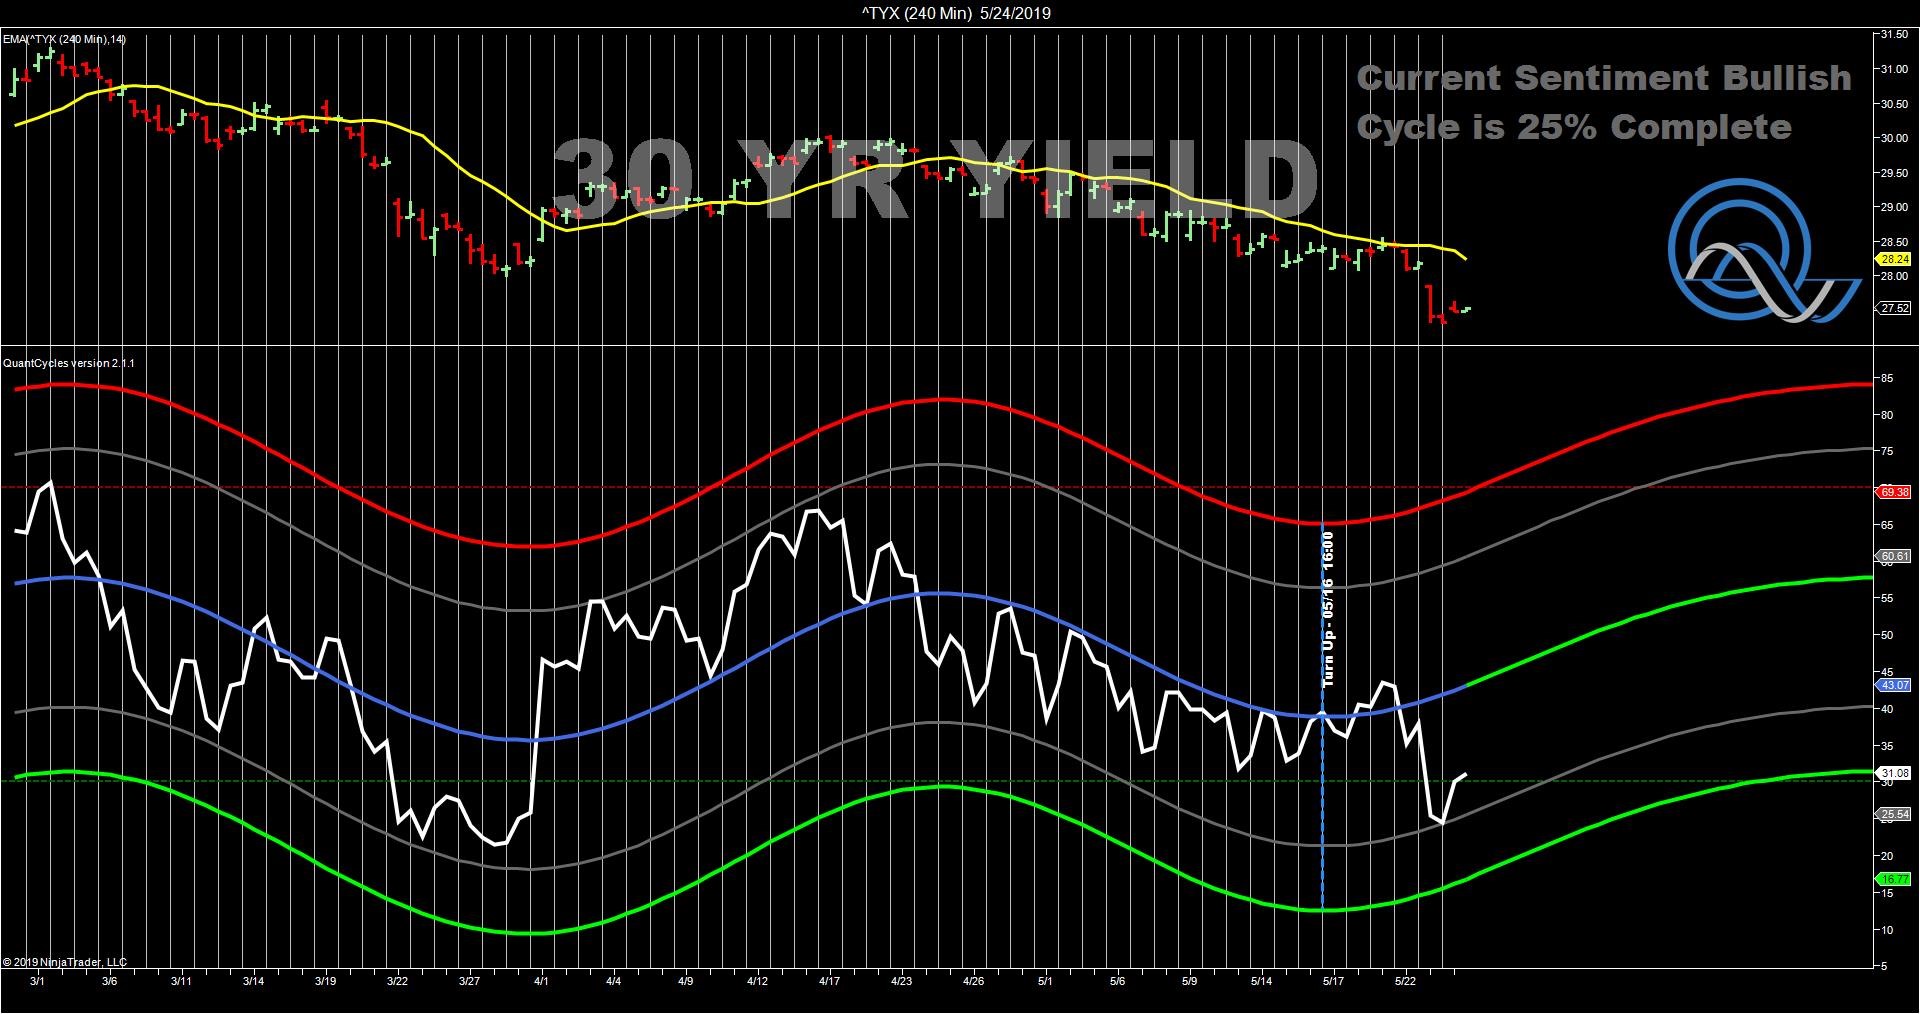
Matching the longer-term outlook, the four-hour chart on the 30-year bond yield turned up last week with yields near oversold territory.
This appears to be confirmation that the recent bond rally is due a correction and yields will soon rise.
John Rawlins described the value of the QuantCycles Oscillator recently at The Orlando MoneyShow.
The QuantCycles indicator is a technical tool that employs proprietary statistical techniques and complex algorithms to filter multiple cycles from historical data, combines them to obtain cyclical information from price data and then gives a graphical representation of their predictive behavior (center line forecast). Other proprietary frequency techniques are then employed to obtain the cycles embedded in the prices. The upper and lower bands of the oscillator represent a two-standard deviation move from the predictive price band and are indicative of extreme overbought/oversold conditions.


