

ConocoPhillips has taken some lumps but appears prime for a rebound, notes John Rawlins.
When fundamentals clash with technical one side has to lose, but sometimes it can enhance opportunities. A news event can circumvent a cyclical signal, but that only makes the signal stronger if it is long-term in nature. Here is an example in the roughed-up energy sector.
Perhaps no sector has been hit so severe in the recent equity selloff as energy. The combination of signs of a weakening global economy and a ramped-up trade war between the two largest economies has hit the sector hard. The Energy Select Sector SPDR Fund (XLE) is down more than 15% from its April high.
ConocoPhillips (COP) has dropped more than 10% in the last month and 33% since Oct. 1.
The long-term (weekly) QuantCycles Oscillator had COP making a bottom in early June. The stock dutifully began to rebound until negative fundamental factors came into play. The resultant selloff pushed COP near oversold territory with a bullish long-term outlook through October (see chart).
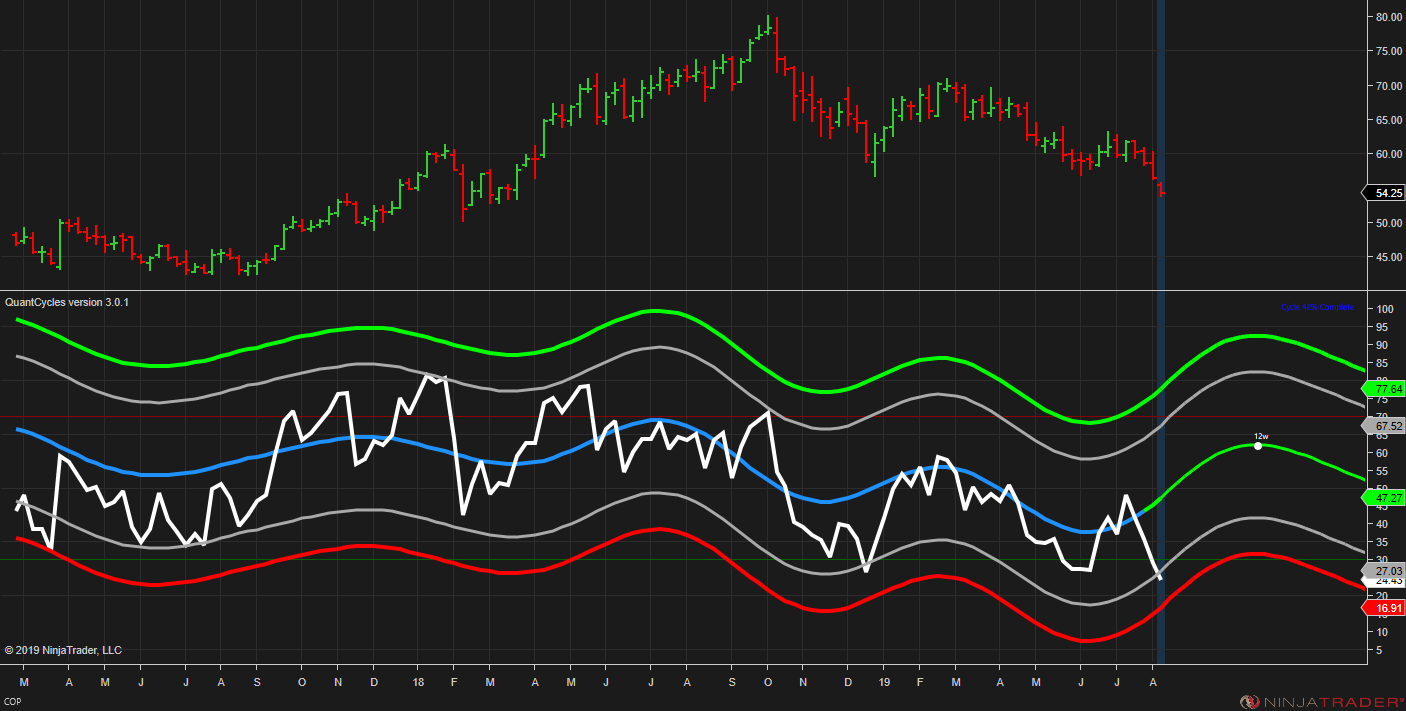
You can see this much more clearly in the daily QuantCycles chart.
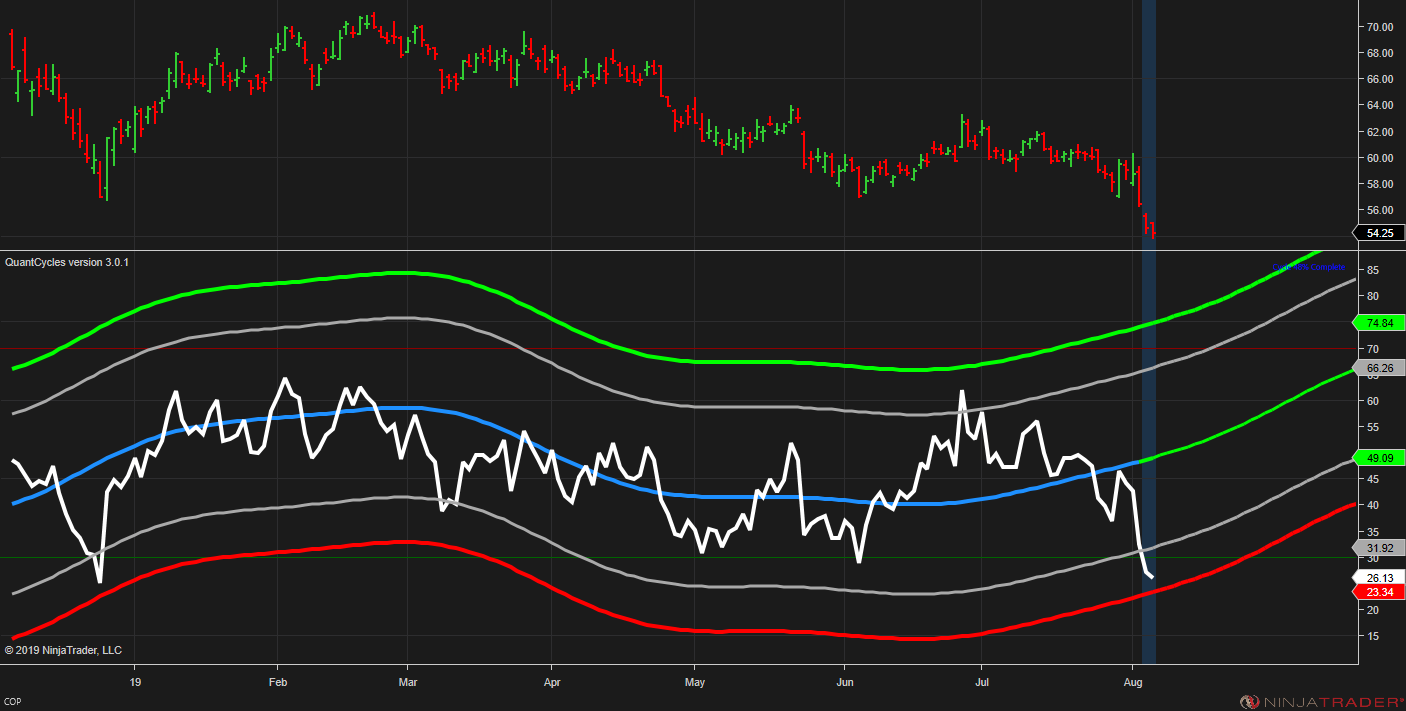
COP is clearly in an uptrend as its recent selloff approached oversold territory. While there is likely more bad news coming, much if it is priced in, especially given the recent weakness in COP and the broad energy sector.
This means that the fundamental selloff has created a value play based on the cyclical outlook.
Making the point clearer, in the case of COP is its four-hour QuantCycles chart. COP has broken below the major oversold line just after the short-term oscillator is turning bullish (see chart).
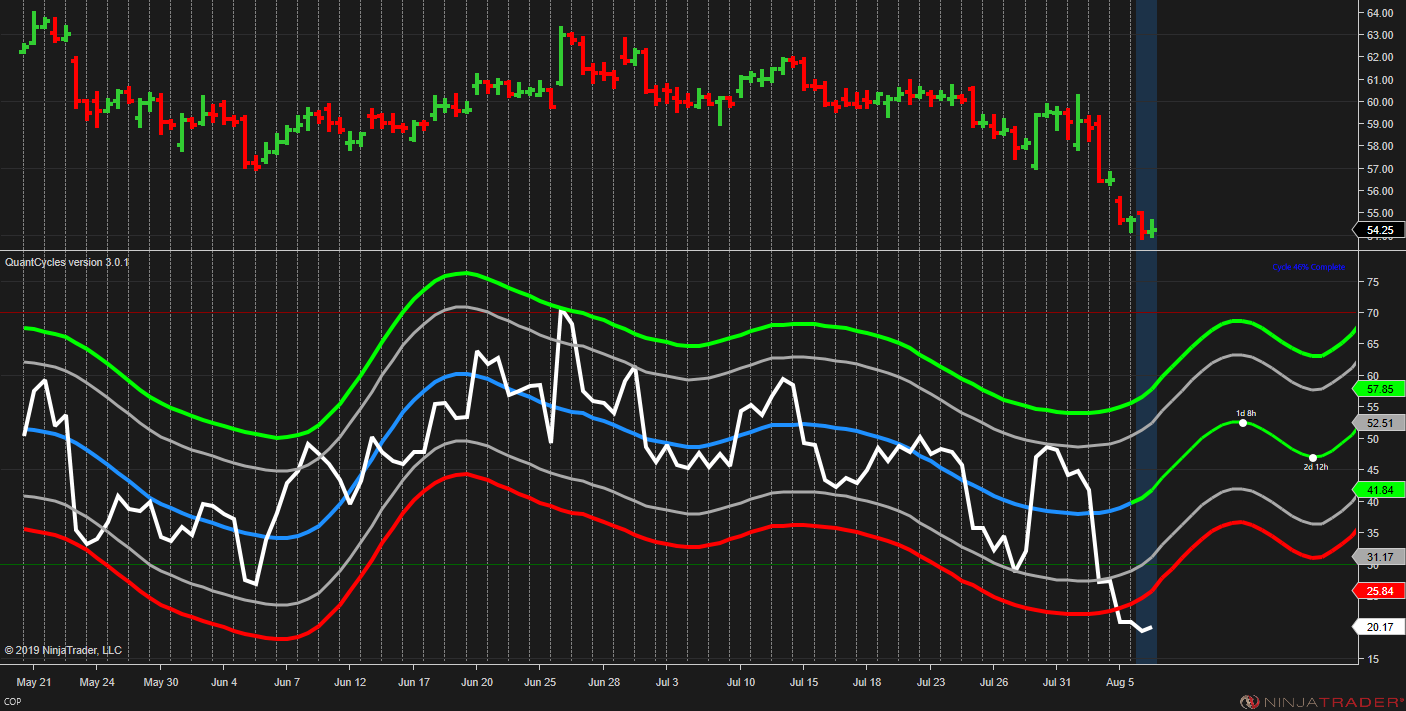
This is a strong buy signal for COP. The various timeframes all are lining up and the bearish fundamentals have been priced in.
John Rawlins described the value of the QuantCycles Oscillator recently at The Orlando MoneyShow.
The QuantCycles indicator is a technical tool that employs proprietary statistical techniques and complex algorithms to filter multiple cycles from historical data, combines them to obtain cyclical information from price data and then gives a graphical representation of their predictive behavior (center line forecast). Other proprietary frequency techniques are then employed to obtain the cycles embedded in the prices. The upper and lower bands of the oscillator represent a two-standard deviation move from the predictive price band and are indicative of extreme overbought/oversold conditions.


