The Deutscher Aktien Index (DAX) is Germany’s primary blue-chip stock index, most similar to the U.S. Dow Jones Index. The DAX index consists of 30 of the largest companies traded on the Frankfurt Stock Exchange, which represent around 80% of the market capitalization listed in Germany.
Germany is the largest individual European economy, the DAX is a very important index in Europe, which makes it highly influential on U.S. markets. While the Euro Stoxx 50 has officially become the benchmark stock index for the Eurozone, may U.S. traders like to get their overnight cue on Europe from action in the DAX. as a benchmark forWhenever confidence in the global economy is down and traders are fearful, traders take their money out of the stock markets, which leads to a drop in the values of the DAX and S&P500. Hence, traders follow DAX (or Mini DAX) and EUR/JPY indexes closely to predict the S&P futures and U.S. Stocks.
Inverse Head and Shoulders Pattern
One of the most popular chart patterns in market analysis is "Head and Shoulders" (H&S) pattern. The H&S patterns form near market tops in an established sideways to up-trending or bullish markets. The H&S patterns are reversal patterns as they reverse its prior uptrend and follow a bearish or downtrend from its breakdown. These patterns are signified by three successive peaks (tops) resembling two shoulders on both sides and a head in the middle. The head is the largest of the three peaks. An Inverse Head and Shoulders (Inv. H&S) pattern is the head and shoulders pattern upside down (mirror image) and follows a similar structure and trading rules (in reverse) as H&S pattern. The Inv. H&S patterns are also reversal patterns and form in established downtrends.
Trading Inverse Head & Shoulders Pattern
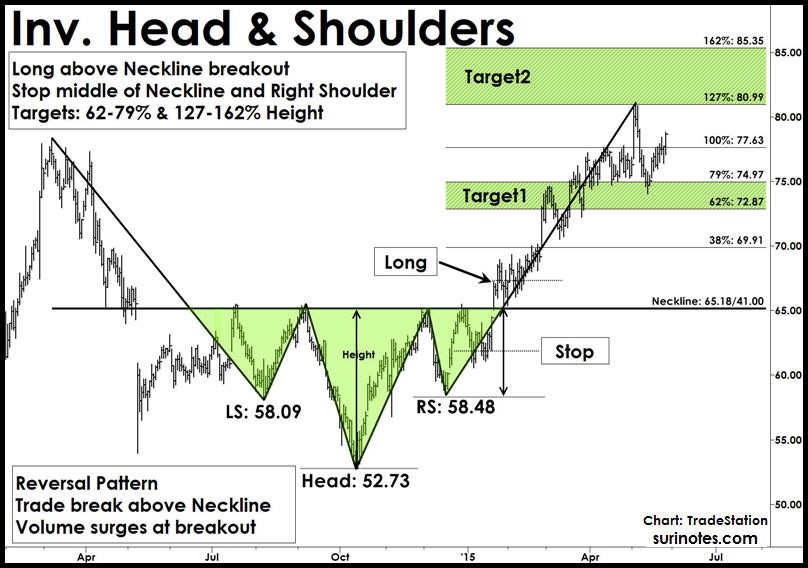
Entry: After right-shoulder formation and pattern completion, if price closes above the neckline with increased volume, enter a long trade above the breakout bar's high.
Stops: 1. Place a stop below the middle of neckline and right-shoulder 2. Place a final stop below the low of the right shoulder.
Targets: Targets are projected from the neckline level. Measure the height of the head and use Fibonacci ratios to compute targets. The first target range is 62-79% of the height of the head, and the second target range is 127-162% above neckline.
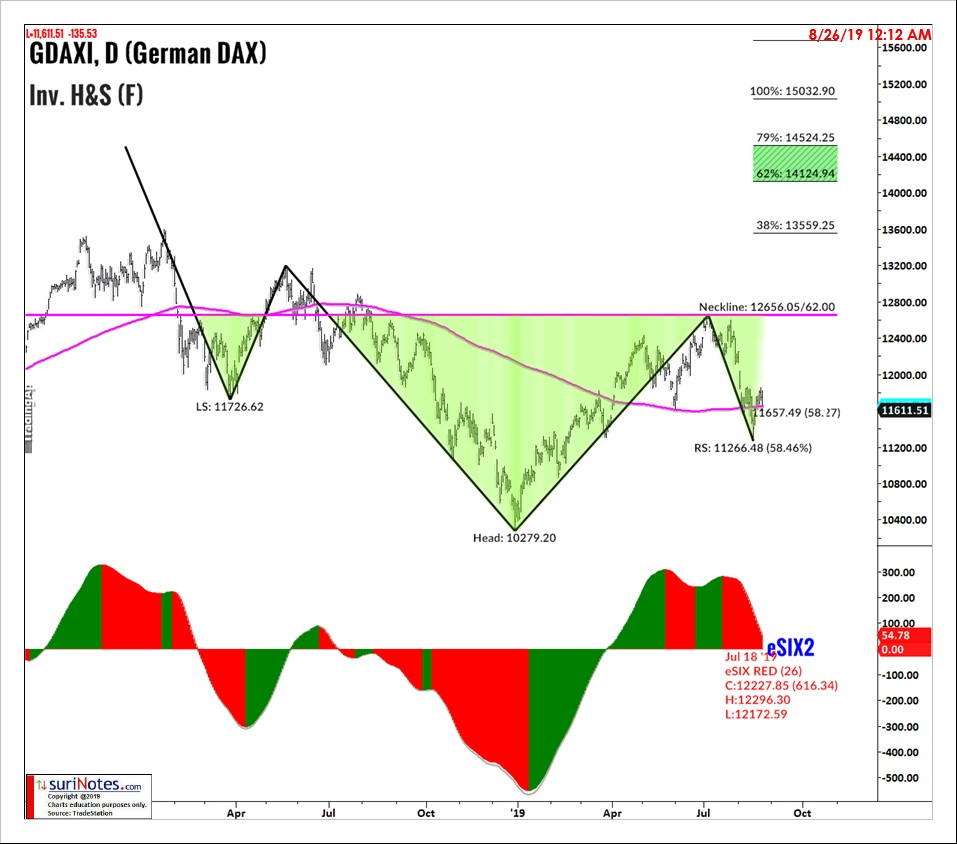
DAX Inverse Head and Shoulders Pattern
The following chart shows the DAX Index Inverse Head and Shoulders pattern formation from March 2018 to now.
This pattern is considered complete when prices close above the neckline (12656). If prices close above the neckline, a long trade may be entered with first target of 13559, and next target range of 14124-14524. A Stop is placed below the midpoint of Neckline and right shoulders low (11266). Inverse patterns are only valid when price closes above neckline.