

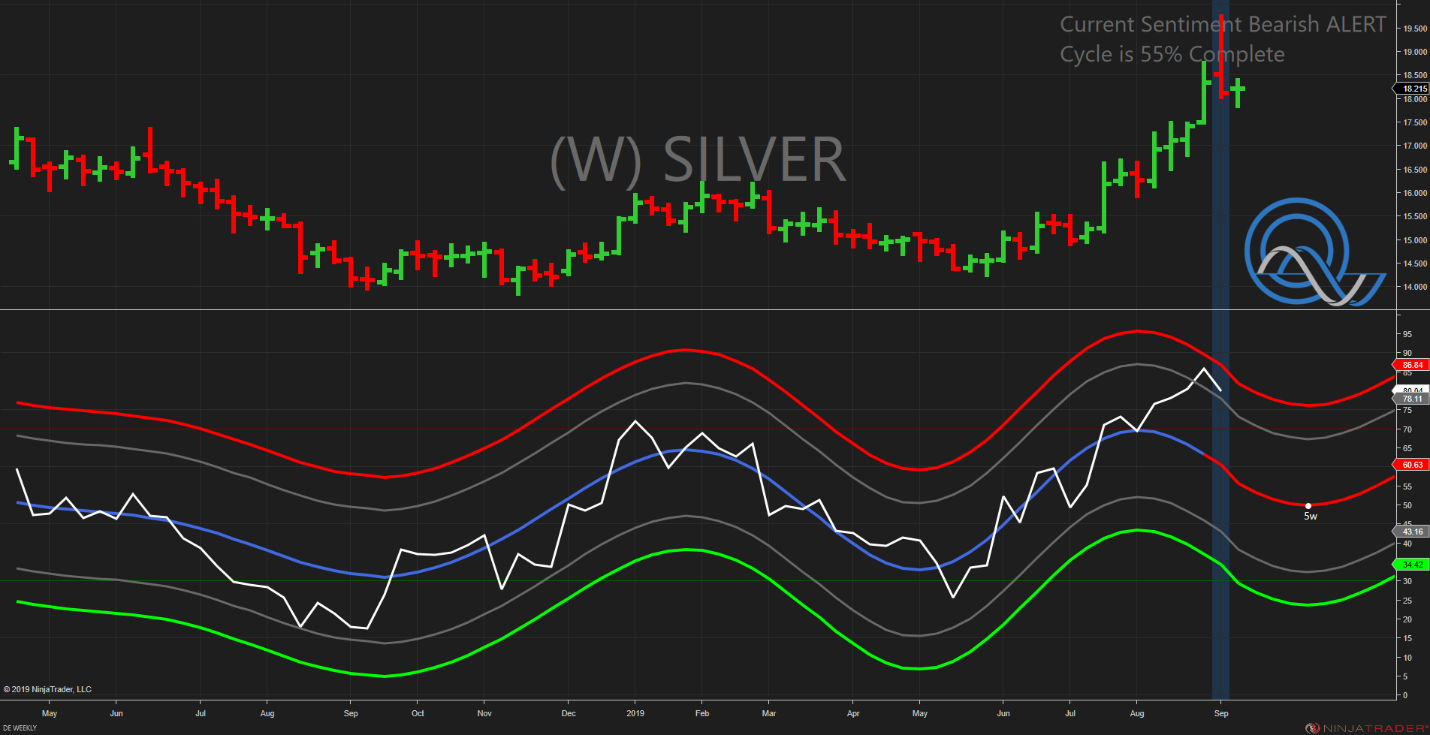
Silver made a blow-off top last week and appears extremely overbought, reports John Rawlins.
Since breaking out in August, jumping ahead of even gold, silver has been on a tear.
Last week, however, the weekly bar in silver indicated a potential blow-off top to the rally as it spiked to multi-year highs before setting below its weekly open.
The QuantCycles Oscillator on the weekly chart had already indicated a top around the beginning of August so silver is in extreme overbought territory (see chart).
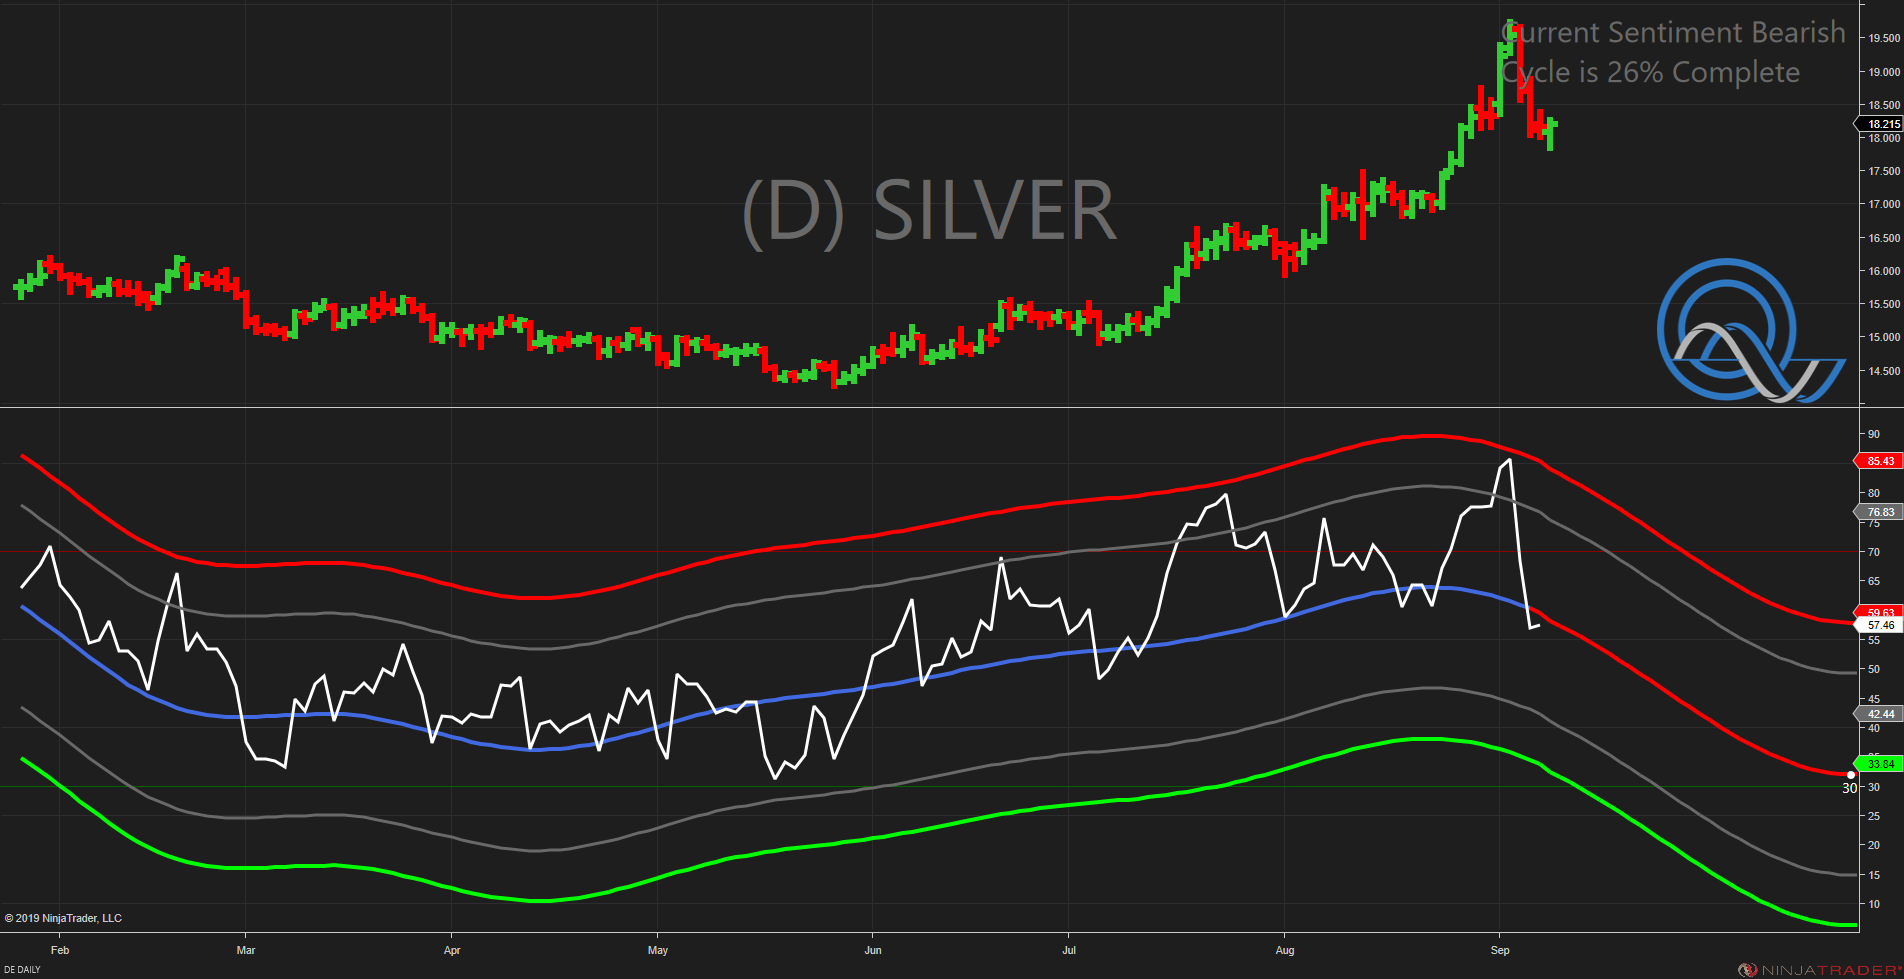
The QuantCycles Oscillator on the daily chart confirms this. In fact, the sell-off began last week, but has a ways to go when looking at the weekly and daily charts.
When looking even shorter-term it becomes apparent that if you didn’t catch this move on Friday, you may want to wait for a short-term move higher to short silver from a better level.
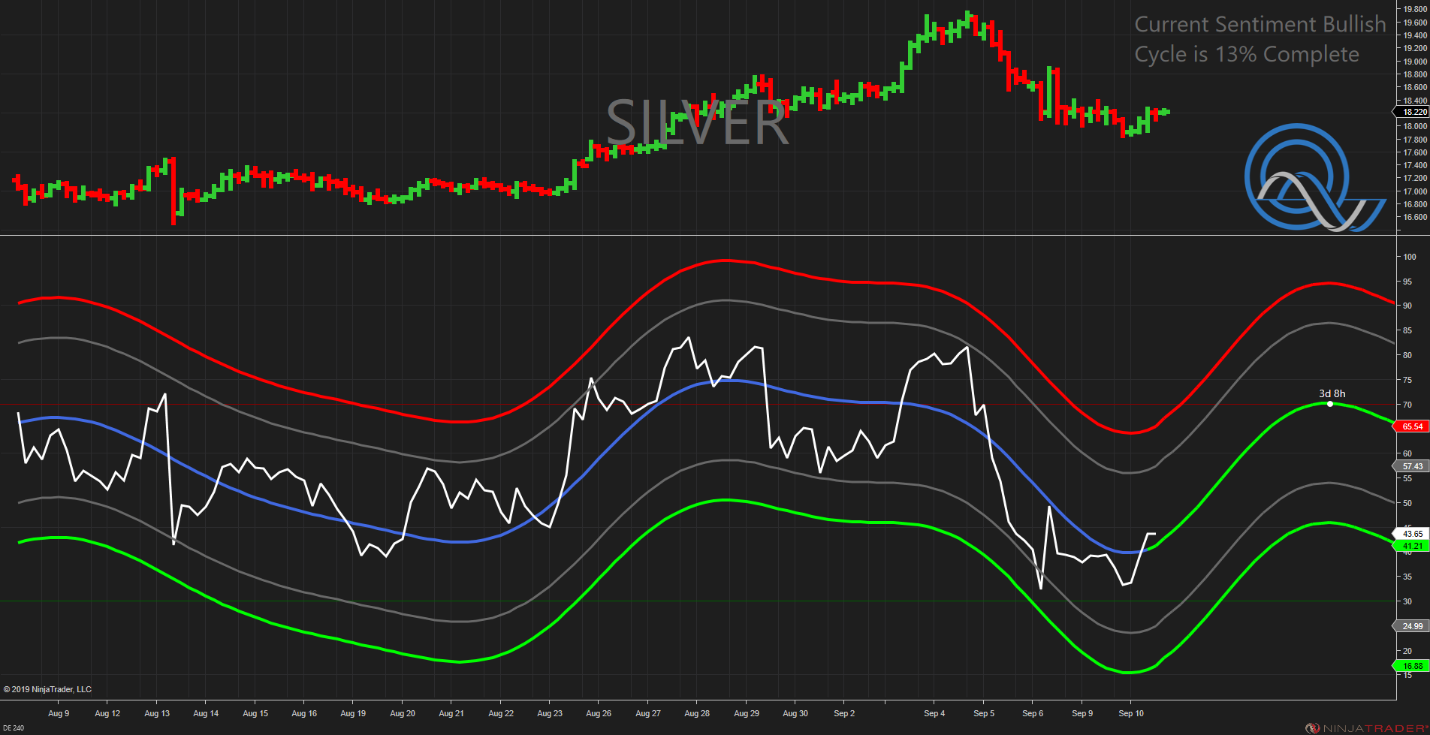
While the four-hour oscillator appears slightly bullish, if you are trading from a longer-term perspective you may not want to wait. Silver clearly set a top and appears extremely overbought on the daily and weekly charts.
John Rawlins described the value of the QuantCycles Oscillator recently at The Orlando MoneyShow.
The QuantCycles indicator is a technical tool that employs proprietary statistical techniques and complex algorithms to filter multiple cycles from historical data, combines them to obtain cyclical information from price data and then gives a graphical representation of their predictive behavior (center line forecast). Other proprietary frequency techniques are then employed to obtain the cycles embedded in the prices. The upper and lower bands of the oscillator represent a two-standard deviation move from the predictive price band and are indicative of extreme overbought/oversold conditions.


