

The Well Fargo rebound is hitting double top resistance and could resume its bear trend, writes John Rawlins.
The Banking Sector has underperformed the broad market in 2019. Wells Fargo & Co. (WFC) made its 2019 high in March and has not approached it, drifting lower most of the year.
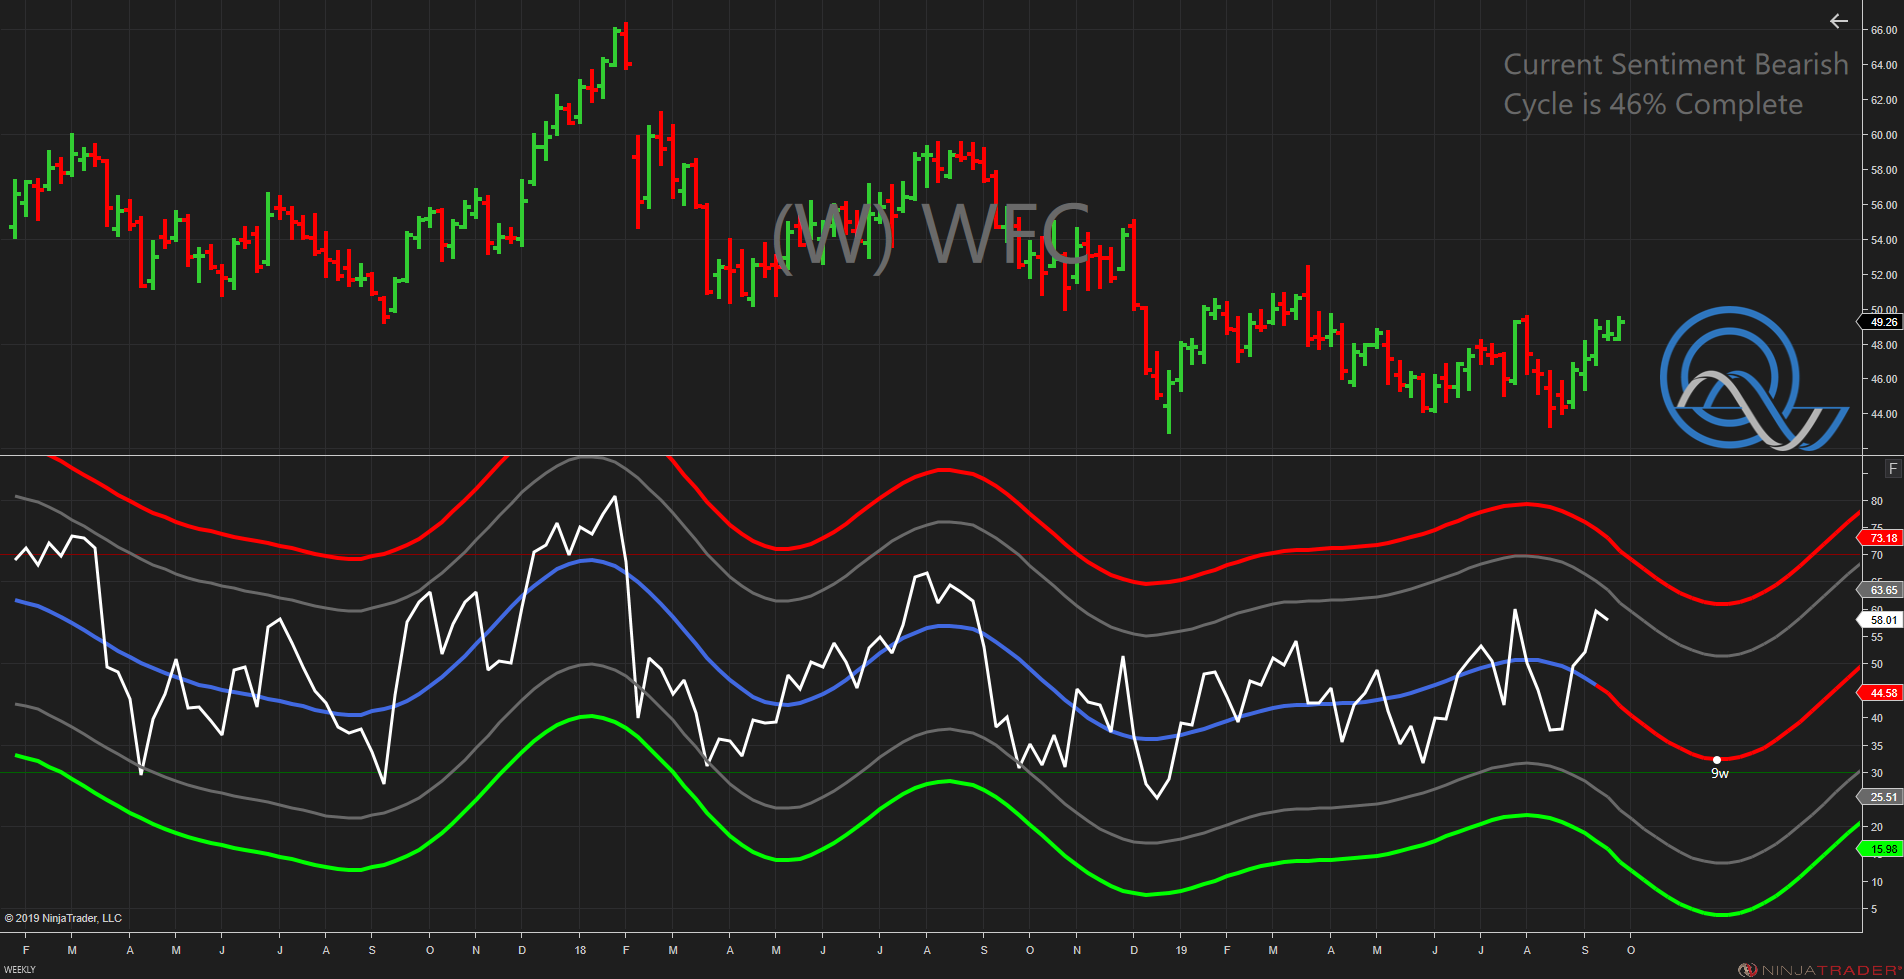
However, WFC has rallied roughly 15% in the last six weeks and tested its July 26 high earlier this week (see top portion of chart below).
The rally is nearing overbought territory just as the weekly QuantCycles Oscillator turned lower. With a double top on the weekly chart this is a potential sell.
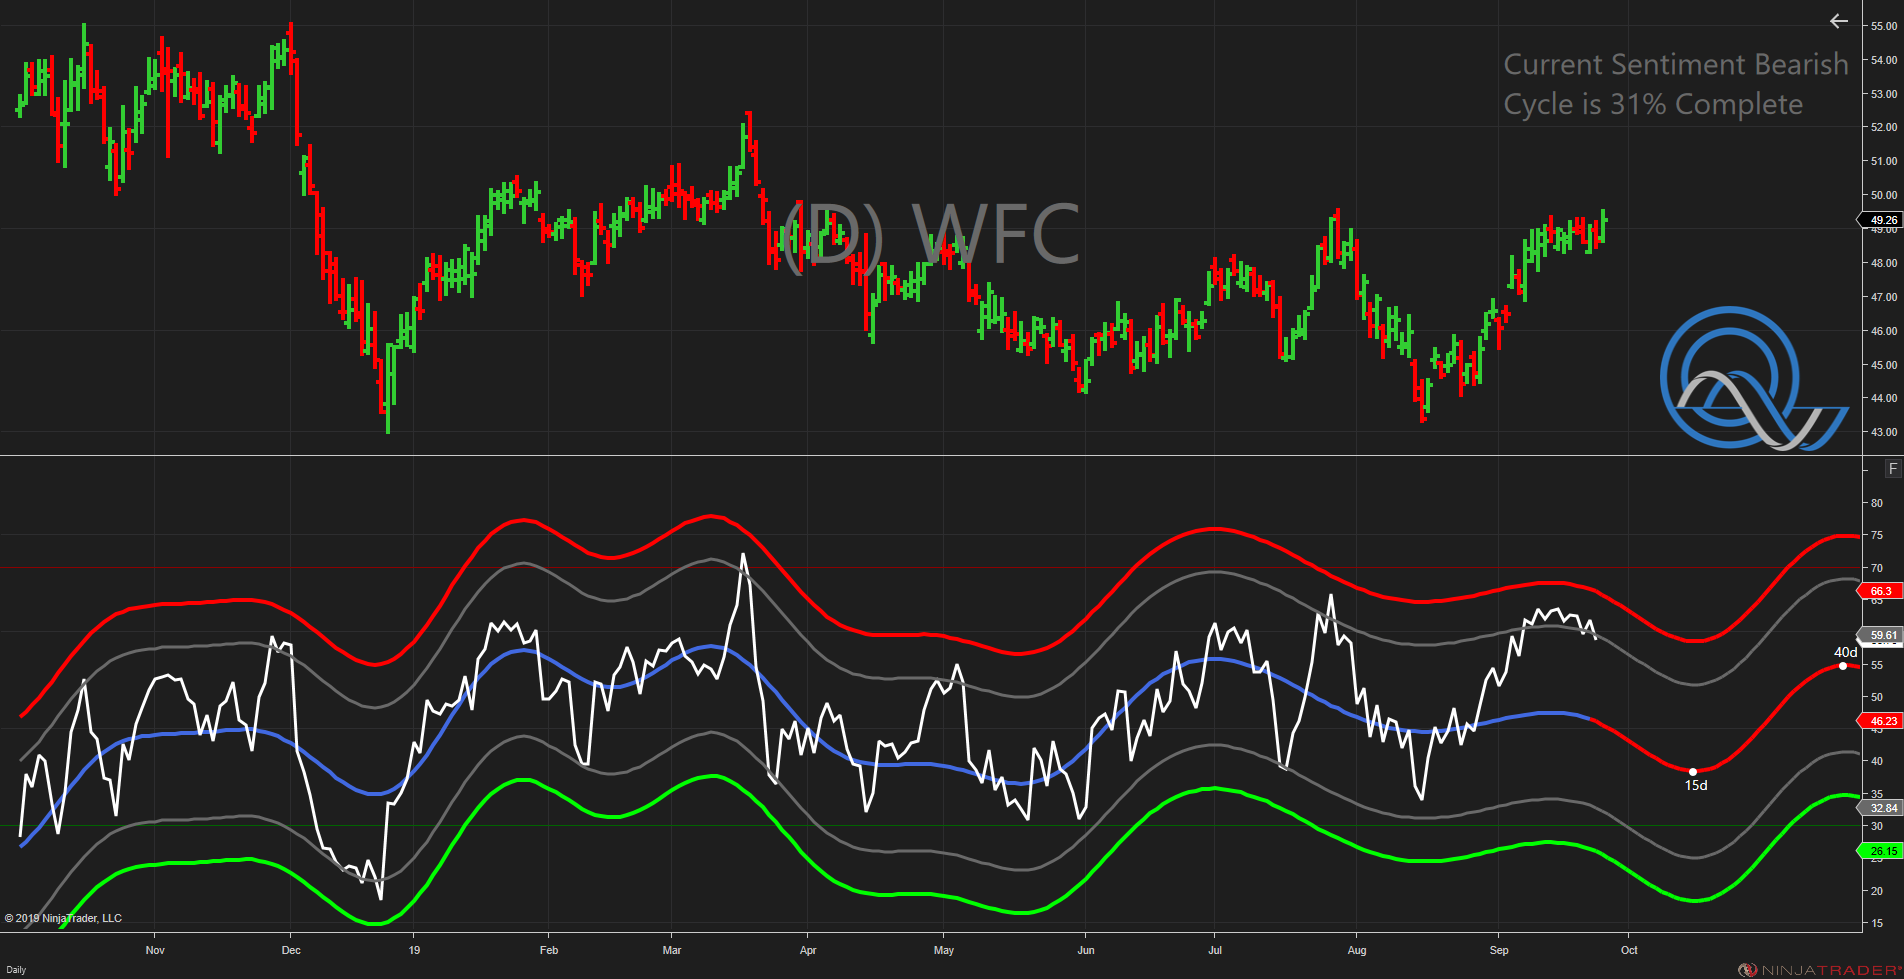
On the daily QuantCycles, WFC appears more overbought and the late summer rally appears to have stalled near this double top. The oscillator has turned lower in an accelerating slope, which is expected to last for the next 15 trading days (see chart).
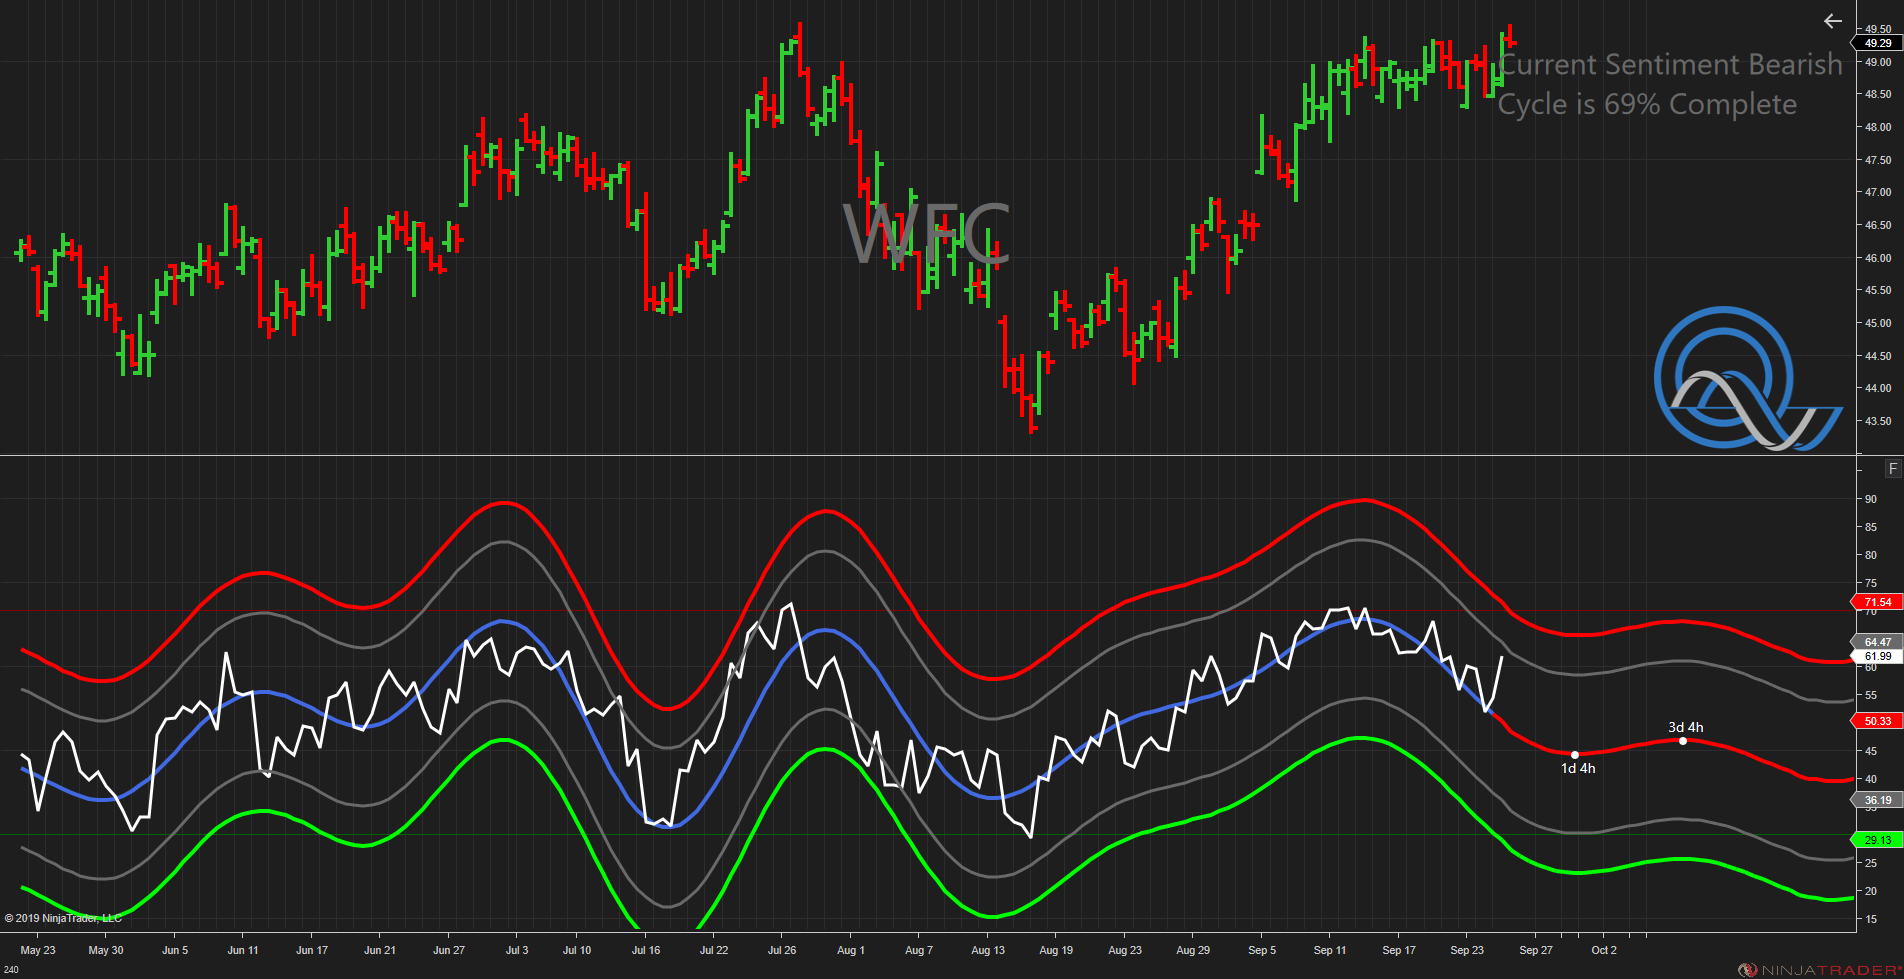
The 240-minute chart confirms the sell signal. This is a strong short signal as the recent double top provides strong resistance for WFC.
Both the weekly and daily oscillator indicate that WFC will turn significantly higher later in the fall so traders should set profit target and trailing stops.
John Rawlins described the value of the QuantCycles Oscillator recently at The Orlando MoneyShow.
The QuantCycles indicator is a technical tool that employs proprietary statistical techniques and complex algorithms to filter multiple cycles from historical data, combines them to obtain cyclical information from price data and then gives a graphical representation of their predictive behavior (center line forecast). Other proprietary frequency techniques are then employed to obtain the cycles embedded in the prices. The upper and lower bands of the oscillator represent a two-standard deviation move from the predictive price band and are indicative of extreme overbought/oversold conditions.


