

The October bullish breakout in the euro has failed, now the bears are looking to retrace some of that move, writes Al Brooks.
The EURUSD currency pair has been in a bear trend for two years. There has not been consecutive strong bull trend bars on the monthly chart at any point. However, the October rally on the weekly chart was strong enough to lead to a continuation of the three-month trading range for at least another month (see chart).
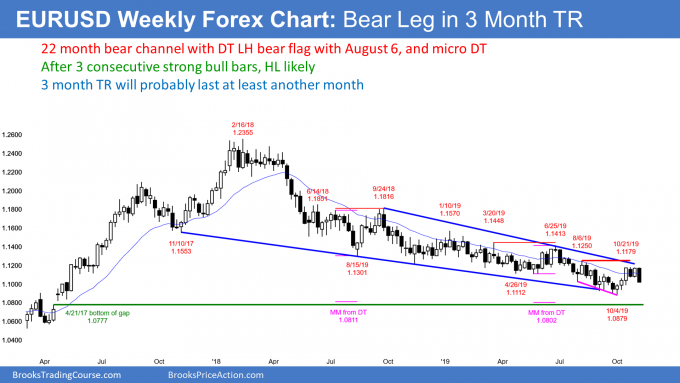
The EURUSD weekly bar rallied for three weeks and then pulled back two weeks ago. The next week formed a bull bar closing on its high. That was High 1 bull flag buy signal bar.
The week ending Nov. 1 had to go above the high of that bull bar to trigger the weekly buy signal. It could not. Instead, it reversed down from within a fraction of a pip of the top of the bull bar. This is a sign of weak bulls and strong bears.
Last week then traded below the low of the bull bar. There is now a micro double top on the weekly chart at the 20-week exponential moving average in a 22-month bear trend. Furthermore, Last week is now a sell signal bar for this week. The bears are hoping that the two-year bear trend is resuming.
The three-week rally in October was the strongest leg up on the weekly chart since the bear trend began in February 2018. I have talked about this regularly in my daily updates. Traders should expect around a 50% retracement down from the three-week rally. This selloff might test the September lows, which was support.
The bulls will probably soon buy again and that will start a second leg sideways to up. Therefore, the selloff will probably only last two to three weeks before the bulls return. But the best they probably will achieve is a continuation of the three-month trading range for another month or so.
In my Oct. 26 weekend update, I discussed the monthly chart. I made the point the bulls have been unable to create two consecutive strong bull bars at any point in the past 22 months. That makes that it difficult for the bulls this time as well.
However, if the bulls buy around a 50% pullback or a test of the September lows on the daily chart, that could lead to another month or two of sideways to up trading. That is the most likely result.
Trading Room
Traders can see the end of the day bar-by-bar price action report by signing up for free at BrooksPriceAction.com. I talk about the detailed E-mini price action real-time throughout the day in the BrooksPriceAction.com trading room. We offer a two-day free trial.


