

The 30-year Treasury bond will probably be sideways to down for many months, writes Al Brooks.
The 30-year U.S. Treasury bond futures are drifting down from a buy climax, which typically leads to sideways trade.
The 30-year Treasury bond futures reversed down from a yearlong parabolic wedge top in September on the monthly chart (below). September and October were consecutive inside bars. They formed an inside-inside (II) sell signal. November triggered the sell signal when it traded below the October low.
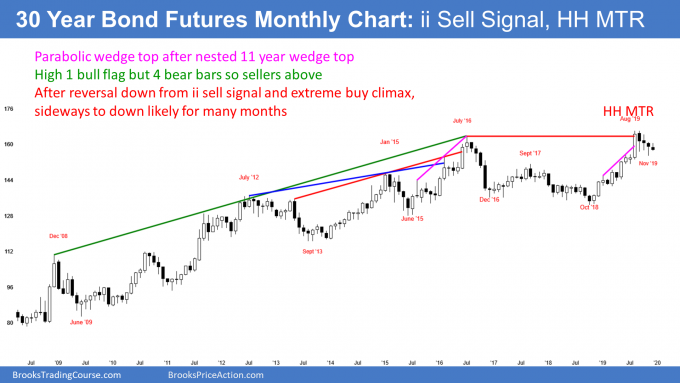
However, the bond market has been sideways since August. While the sell setup was credible, both inside bars had big tails below. They represent traders buying dips. The November entry bar also had a big tail below. In addition, November closed above the October low, despite the big selloff early in November. This is not how bear trends typically begin.
When a parabolic wedge rally is very tight, like this on, the reversal usually is more of a pause than a reversal. The pause sometimes lasts 10 or more bars. Since this is a monthly chart, it could go sideways in a tight range for a year.
Bull flag or developing top?
The bulls see the four-month pullback as a bull flag, and it is. But three or four bear bars makes it a weak buy setup.
Also, there was a nested wedge top in 2016. That is a reliable pattern. I have been saying that a trend reversal on the monthly chart can take years. Even though August broke above the top of the 2016 nested wedge, it is still more likely just part of the topping process than a sign that the top will fail.
Americans will not tolerate negative interest rates. That limits how far up bond futures can realistically go (low rates mean high bond prices). While they have not yet begun to go down, it is much more likely that they will eventually go down before continuing up much higher.
But the bears might need to stop the bulls for a year or more before they are able to take control. In the meantime, traders will expect a continuation of the four-month trading range.
Trading Room
Traders can see the end of the day bar-by-bar price action report by signing up for free at BrooksPriceAction.com. I talk about the detailed E-mini price action real-time throughout the day in the BrooksPriceAction.com trading room. We offer a two-day free trial.


