
While the 30-year bond has been in a long-term topping patten, it could take years to confirm, writes Al Brooks.
The 30-year U.S. Treasury bond futures is in a buy climax on the monthly chart. It will probably enter a trading range for many months.
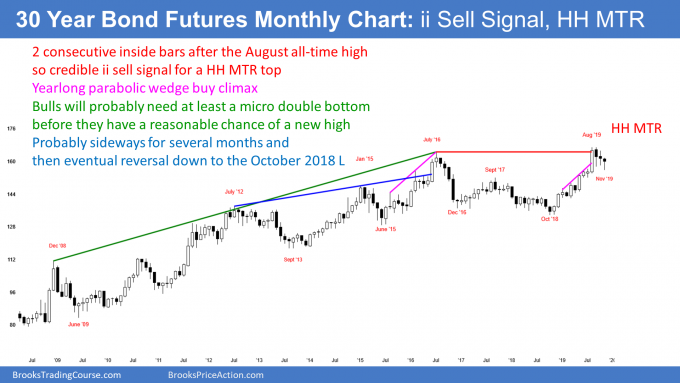
The 30-year Treasury bond market has pulled back for three months. On the monthly chart (see below), November fell below the October low and triggered a buy climax sell signal.
However, with one week left in the month, the long bond futures rallied back above last month’s low. While November’s candlestick has a bear body, it is so far holding above the midpoint of the bar. November is now a buy signal bar for next month. But after three bear bars and a buy climax in August, this is a weak buy signal. There will probably be sellers above the November high.
Buy climaxes attract profit-takers
September and October were consecutive inside bars. They therefore formed an inside inside (II) top sell setup. Traders expected at least a minor reversal down because August was a huge bull bar and it was the third leg up in a parabolic wedge rally in 2019. A big bull bar late in a bull trend typically attracts profit-taking.
When there is a buy climax, the stop for the bulls is far below. Risk managers have to bring the risk back down to an acceptable level. The easiest way to do this is to reduce the size of their positions. This profit-taking typically results in at least a small pullback.
How big will the reversal be?
In this case, the buy climax was unusually extreme. When that is the case, traders wonder if the pullback will be more extreme. The bulls become cautious. They are more likely to wait for more bars before buying again. They want to be confident that the profit-taking has ended.
Also, they want to be sure that the bears were unable to create a bear trend reversal. After an extreme buy climax, this process usually takes at least five to 10 bars. Therefore, the upside over the next several months is small.
In addition, the 2019 bull trend was exceptionally strong. A strong bull trend only rarely immediately reverses into a bear trend. There typically is a transition from a bull trend to a bear trend. This usually requires many bars. Consequently, the downside over the next few months is small as well.
If the monthly chart cannot go up or down much for several months, traders should expect it to be mostly sideways. The trading range could last all of 2020.
Bonds are forming a major top
I have written many times about the nested wedge top on the monthly chart. Bond futures will probably work lower over the next 20 years. This is true even if there is another brief new high first.
However, the top might take many years to complete. For example, the August high could end up as the head of a head and shoulders top. The left shoulder was more than three years ago, in July 2016. There is often symmetry with the head approximately in the middle. If that happens here, the right shoulder could come three years from now. Also, the bear breakout might follow a year or more after that.
While the monthly chart is creating a top that will last for 20 or more years, the current three-year trading range could last for several more years before a bear trend becomes clear. That means that interest rates could remain low for a long time.
It is important to remember what I have said about the possibility of negative interest rates in the United States. The American public will not allow the Treasury to issue bonds with negative interest rates. They will also not allow the Treasury to sell a bond to the public for $100,000, and then when it matures, give the buyer only $95,000. That is what most people mean when they talk about negative interest rates. It is simply implausible for the government to borrow money from its citizens and then charge those citizens a fee for lending the money.
Trading Room
Traders can see the end of the day bar-by-bar price action report by signing up for free at BrooksPriceAction.com. I talk about the detailed E-mini price action real-time throughout the day in the BrooksPriceAction.com trading room. We offer a two-day free trial.


