

With all eyes on historic moves in stock indexes, the two markets that have seen the most sustained extreme moves may be the U.S. Dollar and crude oil, reports Joe Perry.
The U.S. Dollar is in high demand as markets around the world are sold and investors are searching for a place to park their money, which has pushed the Dollar Index (DXY) 2.5% higher on Wednesday to 101.74.
Tuesday’s close was 99.50! DXY is up 3% this month so far, while the range for the month is 6%. Why is the U.S. Dollar so strong? In addition to demand from the flight to safety trade, banks are reluctant to lend cash to low creditworthy firms and foreign banks. They are also concerned that small businesses may not be able to pay back loans. In addition, the companies that do have strong ratings are drawing on their lines of credit to raise cash. These are all contributing to the demand for U.S. dollars. Due to this strong demand, the Federal Reserve is taking unprecedented actions to make sure the supply is there when it’s needed. Some of these actions include slashing interest rates to 0% (from 1.75% in January) and increasing participation in the overnight commercial paper market, which firms use to fund day to day operations.
In order to find resistance for the DXY, we must look at a weekly chart. The dollar is currently trading at the 127.2% Fibonacci extension from the mid-February highs to last week’s lows of 94.60; near 101.30 (see chart below). There is also channel resistance dating back to May 2018 near 101.50. Price has spiked through both those levels today, therefore, today’s highs of 101.74 now become resistance. Above that is 103.86, which is the high in early 2017. Support is 99.90.
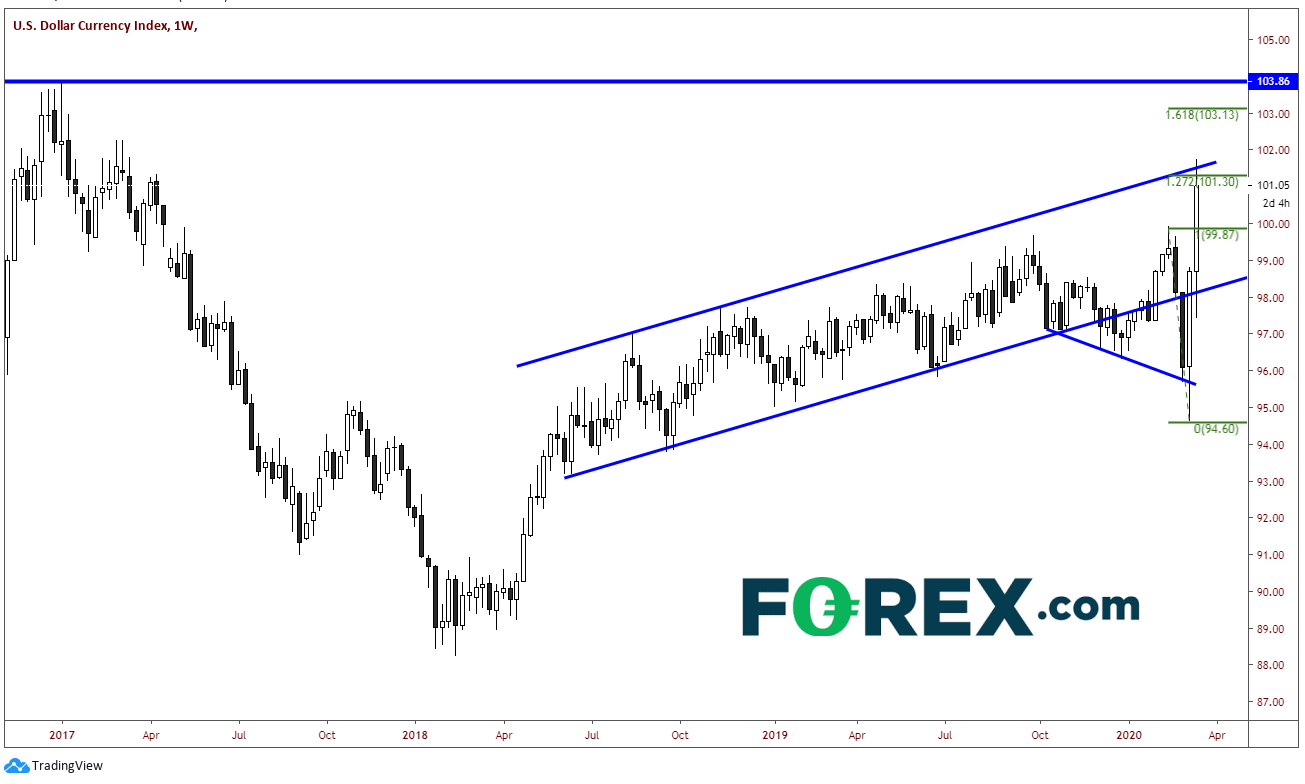
Source: Tradingview, FOREX.com
Take note of the average true range (ATR) on a daily timeframe. The true range is the greatest of the current high less the current low, the absolute value of the current high less the previous close, and the absolute value of the current low less the previous close. Therefore, the ATR is a moving average, usually using 14 days, of true ranges. (Investopedia). From the beginning of 2019 until Feb. 20, 2020, the ATR has been roughly between 30 and 50 pips for the DXY. On Feb.20, it was 0.34, or 34 pips. The ATR began to rise and is currently 1.06, or 106 pips. The average true range for the DXY has tripled over the last month!
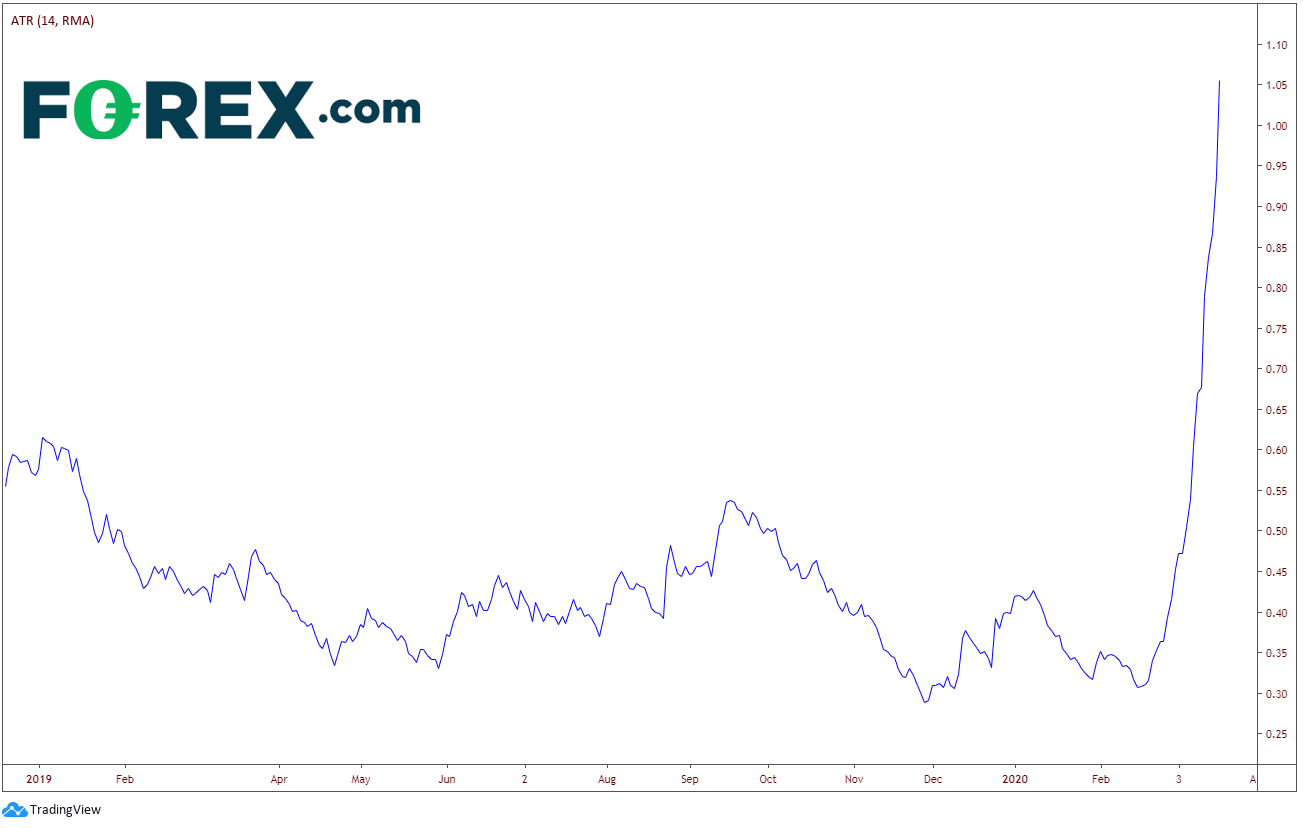
Source: Tradingview, FOREX.com
This is important because traders need to compensate for the volatility in their trading. One way to do this is for traders to decrease the size of their trades to 1/3 of their normal trading size. This will give traders the same risk/reward as if volatility was between the 30 and 50 pips before Feb. 20.
You will see this type of action in the ATR of other instruments as well. Trade safe. Account preservation is paramount!
Oil Collapsing on Fears of Weak Demand
The price of West Texas Intermediate Crude Oil (WTI) is crashing to levels not seen since January of 2002, in the wake of the turmoil after 9/11. As my colleague Matt had written yesterday, WTI had a good chance of reaching support near $25. This was due to the largest demand shock in history, Russia and Saudi Arabia ramping up output, and a surging dollar. Price on Wednesday not only took out the $25 level, but exceeded that target by more than $3.00, trading below the $21 handle to a low of $20.34 at the time of this writing. Price is down more than 21% today alone. In the month of March WTI Crude oil is down more than 51%!
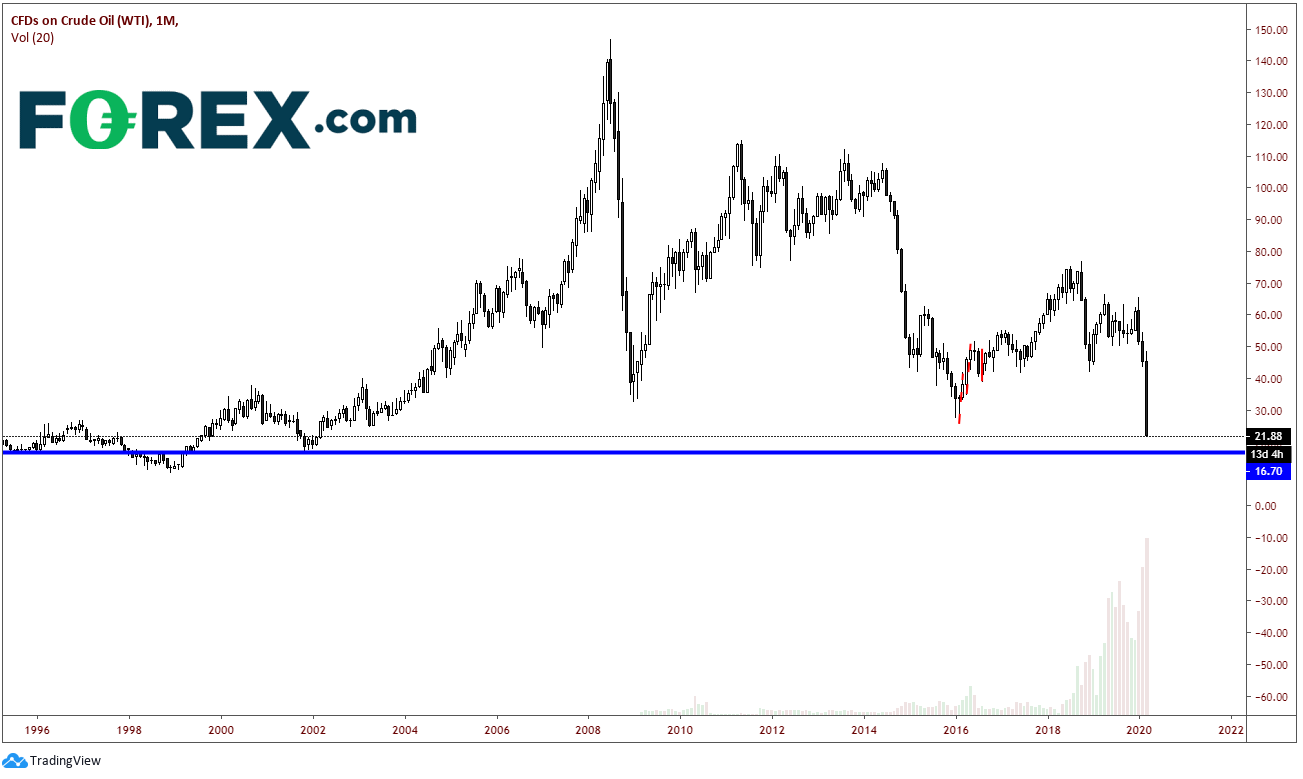
Source: Tradingview, FOREX.com
The next level of support is the psychological round number of $20, then horizontal support from late 2001/early 2002 at $16.70. Given the nature and amount of the selloff Wednesday, it’s difficult to find any meaningful near-term resistance. The first horizontal level is yesterday’s lows near $26.59, then the lows from March 9 at $27.31. That was the Monday after Saudi Arabia challenged Russia on supply output, saying they would pump as much oil as possible.
As one would expect, the relative strength index (RSI) is oversold and diverging from price on the daily timeframe and should be ignored for the time being, as the oscillator has been in oversold territory since March 9 and price continues to move lower.
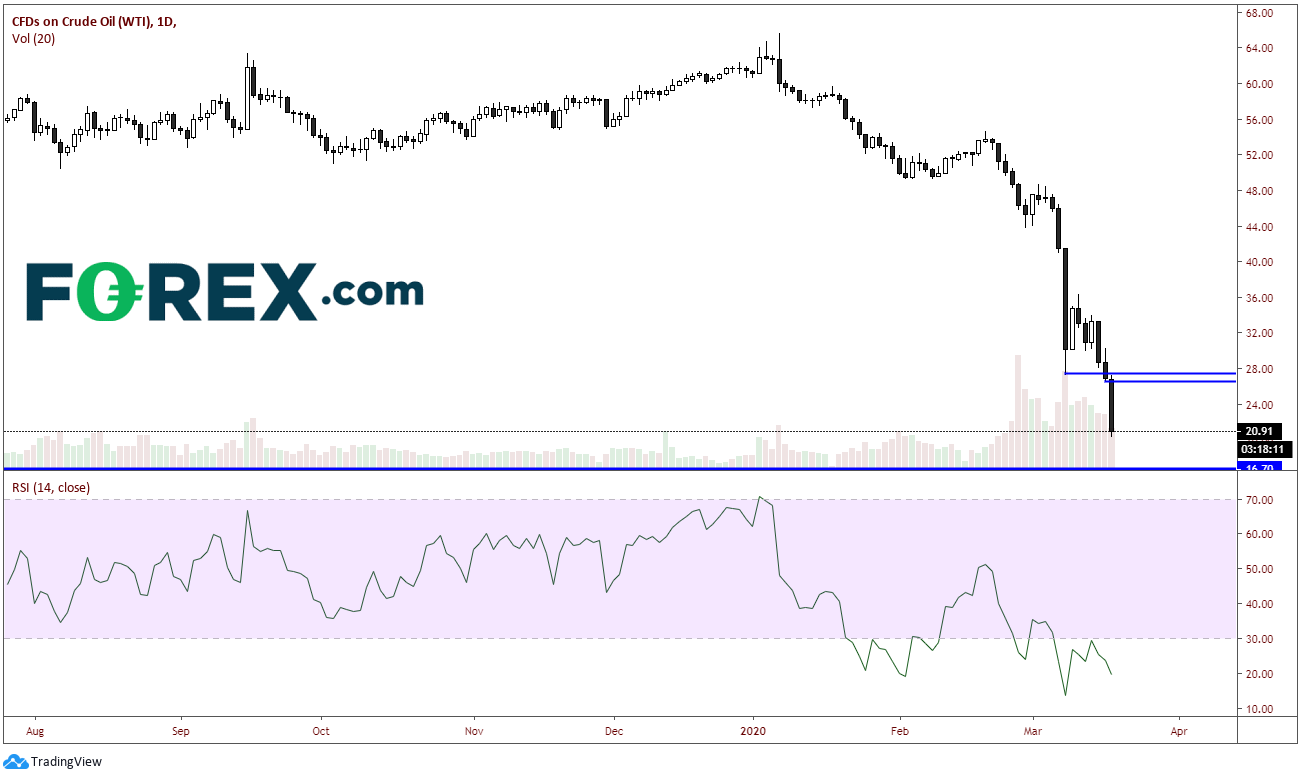
Source: Tradingview, FOREX.com
If one wishes to get involved in trading WTI, please make sure to take small positions and use stops. Preservation of your trading account is paramount, and in these volatile markets, price can move against traders very quickly!
Joe Perry holds the Chartered Market Technician (CMT) designation and has 20 years of experience in the FX and commodities arenas. Perry uses a combination of technical, macro, and fundamental analysis to provide market insights. He traded spot market FX and commodity futures for 17 years at SAC Capital Advisors and Point 72 Asset Management. Don’t forget that you can now follow Forex.com’s research team on Twitter: http://twitter.com/FOREXcom and you can find more of FOREX.com’s research at https://www.forex.com/en-us/market-analysis/latest-research/.


