Bond futures are bouncing from the first reversal from a buy climax. Traders should expect a lower high and another leg down, reports Al Brooks.
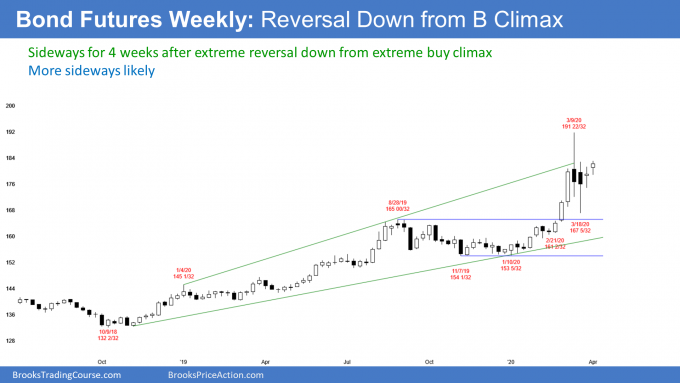
The U.S. 30-year Treasury bond futures pulled back for the past three weeks from the most extreme buy climax in its history. By going above the previous week’s high last week, the weekly chart triggered a High 1 bull flag buy signal this week (see chart).

But the previous week was only a doji bar, which is a weak buy signal bar. That lowers the probability of a significant rally.
Also, the doji followed two huge bars with bear bodies. Those bars formed the big reversal down. They create a bad context for bulls looking for an immediate resumption of the bull trend.
What do the bulls want to see?
When there is an extreme buy climax like that, the bulls take profits and then wait. They are not looking to buy again just three bars later. If that was their thought, they would not have exited.
Because those big bear bars told us that many big bulls exited, traders expect more of a pullback before the bulls will return. My typical guide is TBTL, Ten Bars, Two Legs. Also, I want to see a test down to support, like the 20-week exponential moving average, a breakout point, a bull trend line, or a prior higher low.
Why two legs sideways to down? The bulls want to give the bears at least a couple chances to reverse the bull trend into a bear trend. If the bears fail twice, then the bulls will look to buy again. That is how a High 2 bull flag is created. If the bears fail three times, there is then either a triangle or a wedge bull flag.
The bulls will want evidence that the bears are giving up. They especially like to see several bull bars closing near their highs. Also, they prefer a buy signal bar with at least an average size body and closing near its high.
Another sign that the bears are weak and that the bulls are still strong is if the pullback holds support. Examples include the moving averages, a breakout point, a bull trend line or a prior higher low or a double top.
This pullback has more to go
This pullback is early and there is still work to do. The pullback so far was only one week, and there are now only three sideways weeks since the high. Traders want to see a longer pullback, like about 10 bars. They also want to see two to three legs of sideways to down trading. This pullback has not met these objectives.
The candlestick from two weeks ago was huge and it had a big tail below. The low held above the Aug. 28 breakout point. That candlestick was a successful breakout test. The big tail on the bottom of the candlestick means that the bond futures got near that breakout point, but then reversed up sharply. That is good for the bulls.
However, the pullback has not reached the 20-week exponential moving average, which is a magnet below. Also, it did not test the bottom of the most recent buy climax. That is the low of those three big bull candlesticks in late February.
While the bond futures can still trade higher for another couple of weeks, there will probably be a lower high. Traders expect more sideways to down action before considering buying aggressively.
What about a bear trend instead of a pullback?
It is important to note that the trading range will form some kind of major trend reversal sell signal. For example, there might be a lower high or a wedge rally to a double top.
If these form, then the bears will have a 40% chance of beginning a bigger correction. Their first target would be the November low That is the bottom of a four-month triangle.
A triangle late in a bull trend is an area of agreement. If the bulls break above it, as they have, the market usually sees the price as too high. Traders expect a pullback to the apex of the triangle.
Consequently, there will probably be a pullback to the 154 area at some point this year.
Trading Room
Traders can see the end of the day bar-by-bar price action report by signing up for free at BrooksPriceAction.com. I talk about the detailed E-mini price action real-time throughout the day in the BrooksPriceAction.com trading room. We offer a two-day free trial.


