

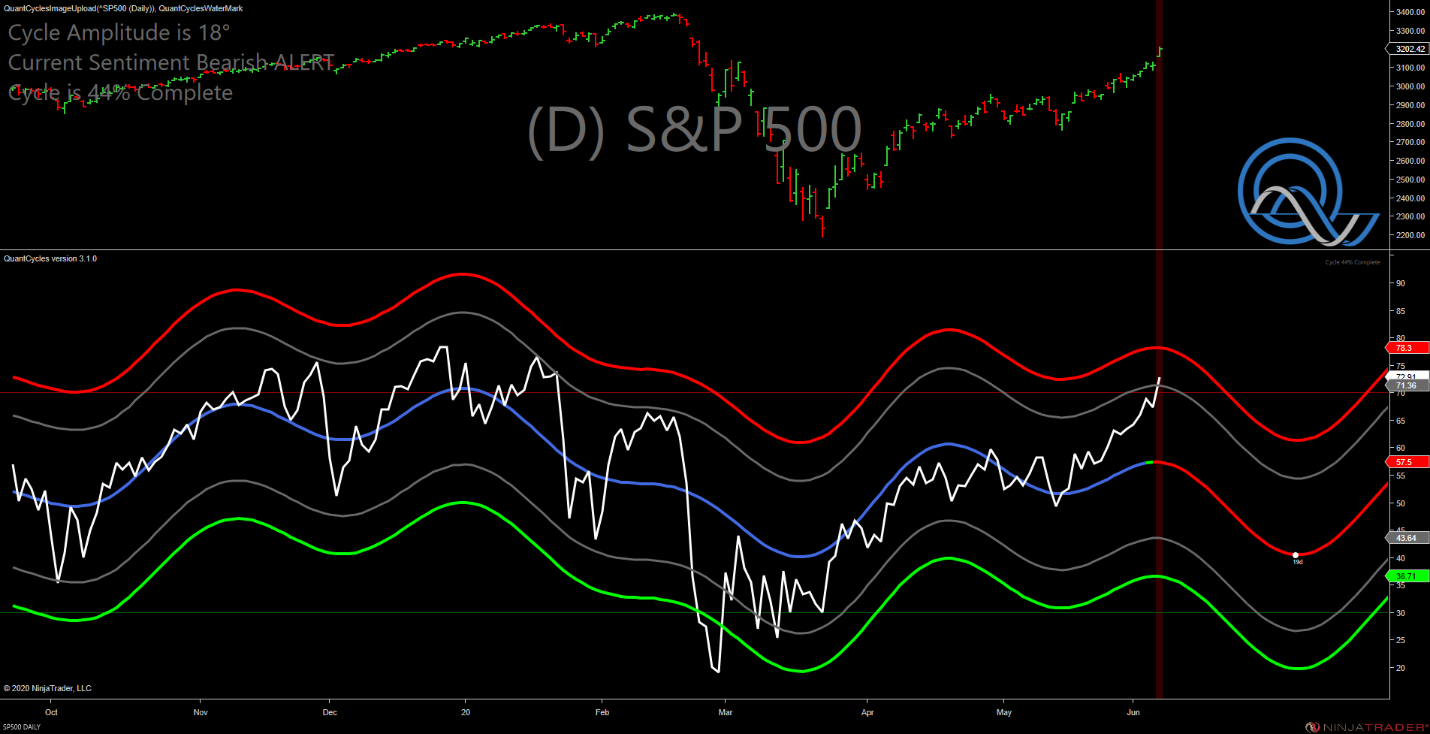
QuantCycle analysis indicates that the S&P 500 may have made a top on Friday, reports John Rawlins.
On Friday, the QuantCycles Oscillator showed an extreme reading on the Daily S&P 500 chart, which indicates that we are probably at or near a peak.
As you can see the oscillator has reached a peak and forecasts a strong decline over the next several weeks.
While all timeframes do not match up, we decided to look at the extreme long-term equity picture. The monthly oscillator in the Dow Jones Index shows us recovering from an extreme back in March. The Coronavirus inspired sell-off pushed the QuantCycles Oscillator into extreme oversold territory, but the monthly analysis is still down for the remainder of 2020.
Obviously, this is while we look at multiple timeframes and why we are conscious of overbought/oversold indicators. The oscillator will show the expected cyclical trend over a specific period of time. There will undoubtedly be noise amid that trend, which is why we look at shorter timeframes and highlight overbought/ oversold conditions.
It is hard to call tops and bottoms, especially as equity indexes are most likely being distorted by the Federal Reserve stimulus.
One clue that we can see a reversal and perhaps more volatility is the daily QuantCycles Oscillator on the Cboe Volatility Index (see below).
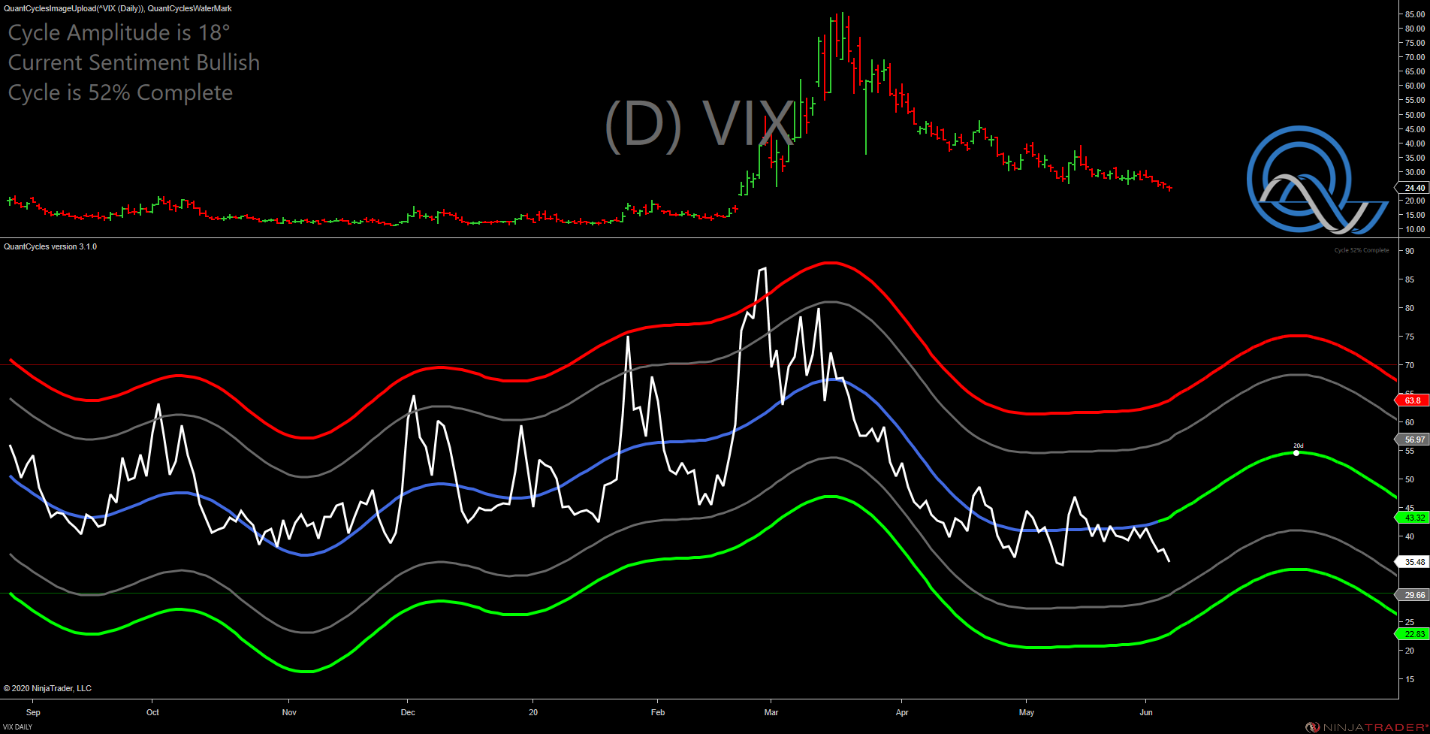
As you can see, after an extended quiet period, the oscillator is predicting a short-term increase in volatility. This adds support to the notion that stocks could be nearing a high.
Energy analysis coming later this week.
John Rawlins described the value of the QuantCycles Oscillator recently at The Orlando MoneyShow.
The QuantCycles indicator is a technical tool that employs proprietary statistical techniques and complex algorithms to filter multiple cycles from historical data, combines them to obtain cyclical information from price data and then gives a graphical representation of their predictive behavior (center line forecast). Other proprietary frequency techniques are then employed to obtain the cycles embedded in the prices. The upper and lower bands of the oscillator represent a two-standard deviation move from the predictive price band and are indicative of extreme overbought/oversold conditions.


