

The E-mini S&P 500 had a Bear Surprise breakout last week, signaling lower prices over the next couple weeks, reports Al Brooks.
The E-mini S&P 500 futures has been in a bull trend for 11 years. However, the huge January/February selloff was a Bear Surprise, as highlighted on the monthly chart (below). A Bear Surprise has a 70% chance of a second leg sideways to down. In 80% of cases, the second leg begins from a lower high. That is why I have been saying that the strong three-month reversal was likely to fail.
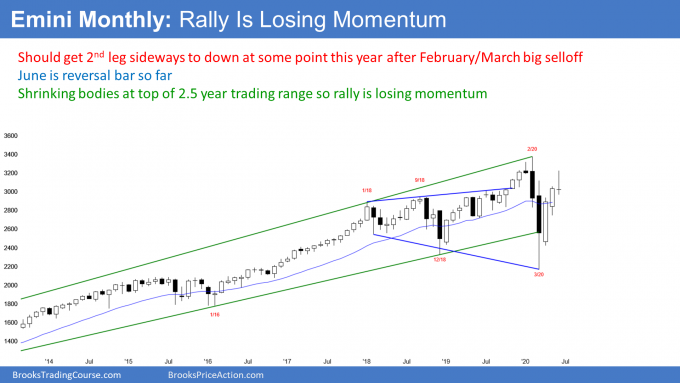
June so far is a reversal bar on the monthly chart. It rallied and sold off. The E-mini is currently near the low of the month. If the month were to close here, it would be a sell signal bar.
This month is bad follow-through after a good entry bar in May. May triggered a High 1 bull flag buy signal bar. It closed on its high, which was bullish. But so far, June is not providing follow-through buying. That weakens the prospects for the bulls.
They had a good buy signal bar in April, a good entry bar in May, but bad follow-through in June. Disappointment is a hallmark of a trading range. June is a reminder that the monthly chart is still in a trading range.
Trading range for the rest of the year
Remember, I have been saying that the monthly chart has been in a trading range for 2.5 years and that it will probably remain in the range for the rest of the year. Therefore, if the E-mini trades down next month, the selloff will likely be minor.
There is plenty of time remaining in June. It could look very different from what it does now. For example, the stock market often rallies at the end of June. That is the end of the quarter and just before the 4th of July holiday. Holidays generally come with some euphoria.
At the moment, June is unlikely to close on its high. However, it could close in the middle of its range. It would then be less bearish going into July.
The E-mini S&P 500 futures reversed down strongly last week on the weekly chart (see below). The previous week was a breakout above six weak bars on the weekly chart. The bulls were hoping that the breakout would continue up to a new all-time high.
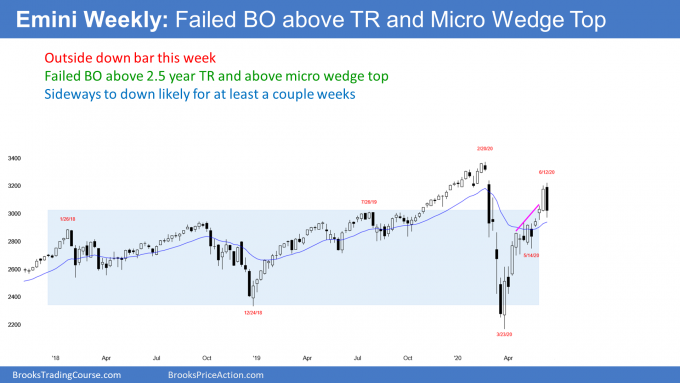
As a rule, 50% of all breakouts fail. Sometimes the context and size of the breakout makes it more likely to be successful. However, I wrote last week that there was still less than a 50% chance that it would lead to a new high.
Last week totally erased the previous week’s rally. In fact, last week traded above the previous week’s high and then below its low. Last week is therefore an outside down candlestick, which is bearish when it comes late in a bull trend.
Last week’s selloff has created a two-week reversal on the weekly chart. While bearish, the E-mini is a tight bull channel. If this is the start of a significant selloff, the selloff will probably not fall below the March low. This is similar to the rally, which I have been saying would probably not go above the February high.
Markets have inertia
The E-mini has been in a trading range for 2.5 years. Trading ranges often look the most bearish at the low, like in March, and then reverse up. They also look the most bullish near the high.
Traders should expect reversals and not breakouts. This is because of my 80% rule. Markets have inertia. They have a strong tendency to continue what they have been going. In trends, 80% of reversal attempts fail. In trading ranges, 80% of breakout attempts fail and reverse.
How low will it go?
One target is a measured move based on the height of last week’s outside down range. That target is 2750. Another is the bottom of the most recent leg up or trading range. That is the lows below 2800.
Traders typically look for a 50% retracement. That is around 2700.
Ten percent corrections are also common. But with how extreme the buy climax was, 15% is more likely. That would be around 2750.
Finally, the market is now more than 10% down from the high. It is therefore back in correction territory. If it falls 20% — to 2700 — it would be back in a bear market. I have written many times that the approximate trading range for the remainder of the year will probably be around 10% to 20% down from the high.
The low of that range is around 2700. Since there is a cluster of magnets around 2700 to 2800, traders should expect the E-mini will get there this summer.
The E-mini futures reversed down sharply on Thursday for its daily chart as well (see below). Friday was the fourth day in the selloff. This is the first four-day pullback since the rally began in March.
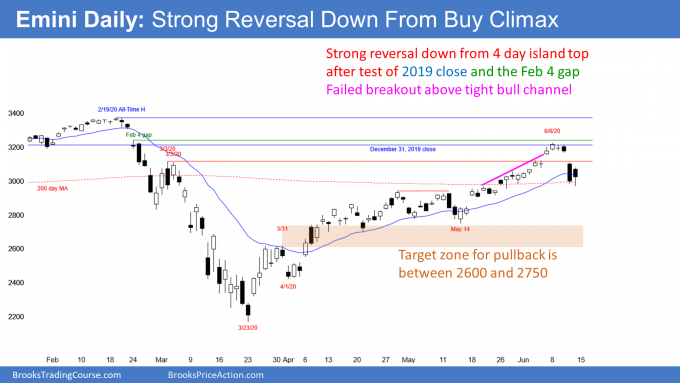
This could be the start of a reversal down from a double top with the February all-time high. When there are double tops, the second high is rarely exactly at the same price as the first high. This is a lower high double top.
A big bear bar like the one on Thursday is a Bear Surprise breakout. Friday’s bear body confirmed the reversal down. Traders expect at least a small second leg sideways to down.
I mentioned last weekend that last Friday’s gap up was exceptionally big and it was testing the top of the two-year trading range. That increased the chance that it was an exhaustive move.
I said that the E-mini might gap down some day this week and create an island top. Thursday’s gap down did just that. Island tops and bottoms are usually minor reversal patterns.
However, this one is after an extreme buy climax. That buy climax followed a huge sell climax. Therefore, the rally was probably going to form a lower high.
What happens if there is a gap up some day this week? That would create an island bottom with Thursday’s gap down. If there was a strong rally, traders will see Thursday as a bear trap and wonder if the rally will resume up to the February high.
The three-month bull channel has been strong. There is therefore still a 40% chance that Thursday was a bear trap and the bull trend will resume next week.
Why did the market sell off?
The news always reports that every market move is caused by the news. That is because they believe they are the center of the universe and they do not believe that technical forces exist.
They therefore are now claiming that the Federal Reserve’s comments last week and an increase in Covid-19 cases caused the selloff. That influenced many traders to sell.
But why is it that I have been saying that the rally would fail to break above the February high? It is because of technical factors, which control all moves lasting a few months or less.
Markets constantly search for fair price
The market is always testing up and down. It needs to find out how far up and down are too far. The market is probing to find the current fair price.
That price changes constantly with every second. The result is that the fair price is a range and not any one price.
I have been saying that no one knew where the top of the rally would be. But, I said with 70% certainty where it would not be. The March selloff was so strong that the rally only had a 30% chance of making a new high. It got near the old high last week.
That meant it was likely to go sideways and then down or simply down. It chose down.
The news is the catalyst but not the cause
Some selling was created by the news, but the selling was going to happen regardless. This is the same as in February when I said the market was going to selloff or in March when I said traders should expect a big V bottom rally.
There is always news at every second of every day. When the market moves, the reporters look at the current news and claim that it was the cause of the move. Nonsense.
Think of the impending move as a bomb. The news flipped the ignition switch.
If it was not this news, it was going to be some other news. The news can affect the speed and size of the move, like how our bungling of the pandemic led to the March crash. But there was going to be a selloff regardless of whether there was a pandemic. It might have come a month or two later, but it was going to come.
Bulls & bears were looking to sell near the Feb. high
I said that there was a lot of supply around the February high. All of the traders who bought in January and February and did not exit watched a 35% selloff. That is huge.
Many were going to be afraid that the market might not make a new high for a long time. They were hoping that the rally would get near their entry price so they could exit with a smaller loss. They did that this week.
Many bulls bought around the March low. They knew there would be supply around the old high. Many took profits this week.
Finally, the bears knew that the selloff was so extreme in March that many bulls would sell near the old high. They therefore sold as well.
All of these sellers created Thursday’s crash.
The three-month rally went higher than what was likely. Because it was stretched far, traders will expect a bigger reversal down over the next few weeks.
Sideways down likely for a few weeks
Can Thursday be a bear trap and will the E-mini immediately reverse back up? The bulls have a 20% chance.
It is important to remember that the E-mini has been in a trading for 2.5 years. Traders should expect disappointing follow-through after any move up and down. This week was disappointing for the bulls after last week’s exceptionally strong rally. The selloff will probably not fall in a strong bear trend. That will disappoint the bears.
However, there is a 60% chance that this selloff is the start of a 15% pullback to around 2750. I talked about the reasons for this in the section above on the weekly chart.
March 31 high just above 2600 is a magnet
There is an additional reason for a possible 15% correction on the daily chart. The March 31 high was never adequately tested.
There is a gap between the April 21 low and that high. Gaps in trading ranges typically close. Consequently, if this selloff gets near 2700, it will probably continue down to below the March 31 high.
Trading Room
Traders can see the end of the day bar-by-bar price action report by signing up for free at BrooksPriceAction.com. I talk about the detailed E-mini price action real-time throughout the day in the BrooksPriceAction.com trading room. We offer a two-day free trial.


