

The Euro is looking to turn up, and this time it might succeed, reports Al Brooks.
The EURUSD currency pair rally has stalled at the two-year bear trend line for four weeks. It might have to test down to the breakout point just above 1.1068.
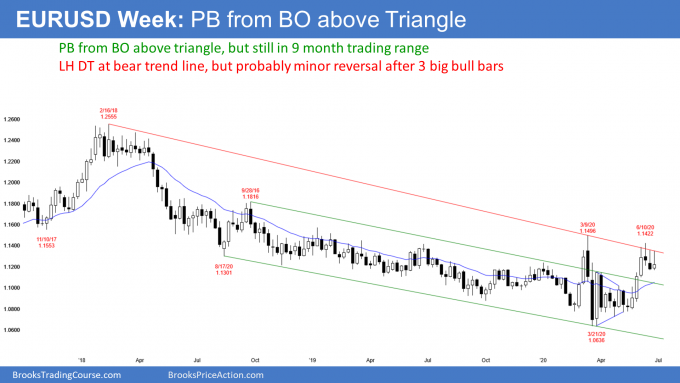
The EURUSD weekly chart has been sideways for four weeks after a strong three-week rally. The bulls hope this is a bull flag. But each of the bars has a prominent tail on top. All four bars tested the two-year bear trend line and reversed down. This is not how an impending breakout typically looks.
Furthermore, when there is a strong breakout, traders expect a pullback to test the breakout point. That is the May 1 high of 1.1018. Therefore, despite the strong rally, the EURUSD will probably pull back for a week or two to test the breakout point and the 20-week exponential moving average.
Can the rally resume and break strongly above the March high without a pullback? Given the appearance of the past four weeks, a pullback is more likely.
The EURUSD monthly chart tested the March high and is forming a lower high in June. It is not near the 12-year bear trend line (see below).
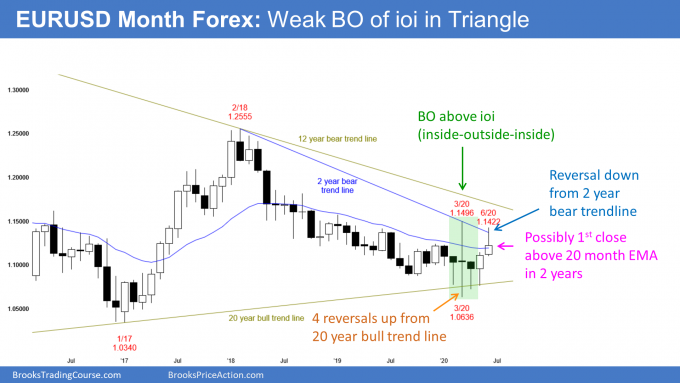
There are still two trading days remaining in June. So far, the month has a small bull body.
More importantly, its close is currently above the 20-month exponential moving average (EMA). If June closes above the EMA, it would be the first time in over two years. Also, there would be consecutive bull bars on the monthly chart for the first time since the current bear channel began in February 2018.
2 year bear channel is weakening
June’s high is below the March high. The monthly chart is still in a bear channel. But these are significant signs that the price action is changing. The bulls are getting stronger and the bears are getting weaker.
Because the monthly chart is still forming lower highs and lows, it is in a bear trend. However, it has been sideways for about a year. It is therefore also in a trading range.
A bear trend often transitions into a trading range before reversing up into a bull trend. What do traders need to conclude that the monthly chart has become a bull trend? A couple consecutive bull bars closing near their highs and above the March high would be enough.
Spike and Channel bear trend
Even if they get their strong breakout above the March high, the bear trend was a Spike and Channel pattern. It spiked down for a couple months in April and May 2018 and then entered a bear channel.
When the bulls get a break above the bear channel, the rally usually tests the start of the channel. That is the top of the first pullback from the spike down. Here, it is the September 2018 high of 1.1816. Then, there usually is a reversal down and that leads to a trading range.
Consequently, even if the bulls get a bull trend over the next several months, it will probably just be a bull leg in what will become a bigger trading range. That trading range could last a couple more years.
Trading Room
Traders can see the end of the day bar-by-bar price action report by signing up for free at BrooksPriceAction.com. I talk about the detailed E-mini price action real-time throughout the day in the BrooksPriceAction.com trading room. We offer a two-day free trial.


