

Daniel Collins points out an extreme overbought stock, which just posted a bearish QuantCycles turn.
Whirlpool had a nice bump last week following its Q2 earnings announcement that showed its Q2 adjusted earnings beat estimates.
That came on the heels of a V-shaped rebound, where WHR recovered all the ground it lost in the March Coronavirus inspired sell-off. In fact, Whirlpool recently set a high that goes back to Q1 2018.
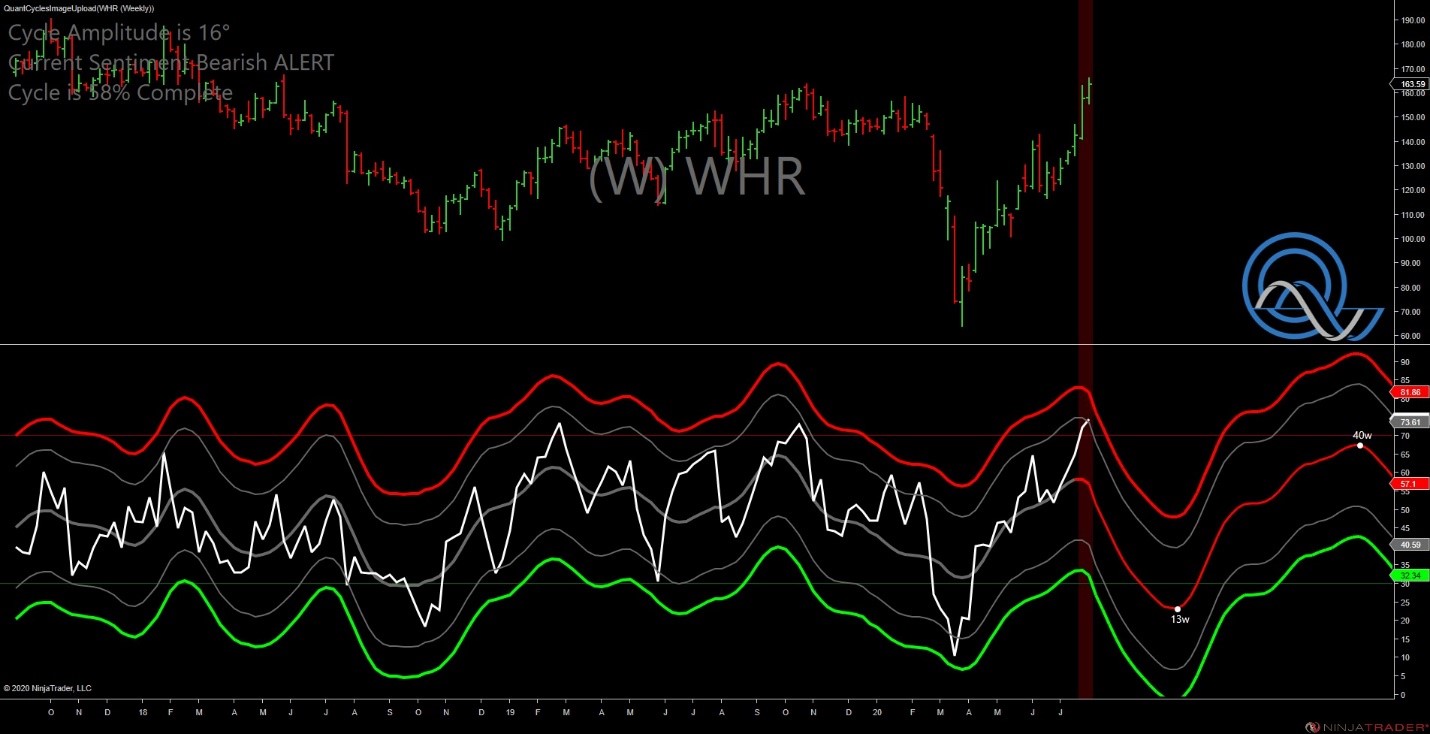
This has pushed Whirlpool near extreme overbought territory just as the QuantCylces Oscillator turned bearish (see chart below).
The weekly oscillator projects a sharp downturn lasting through October.
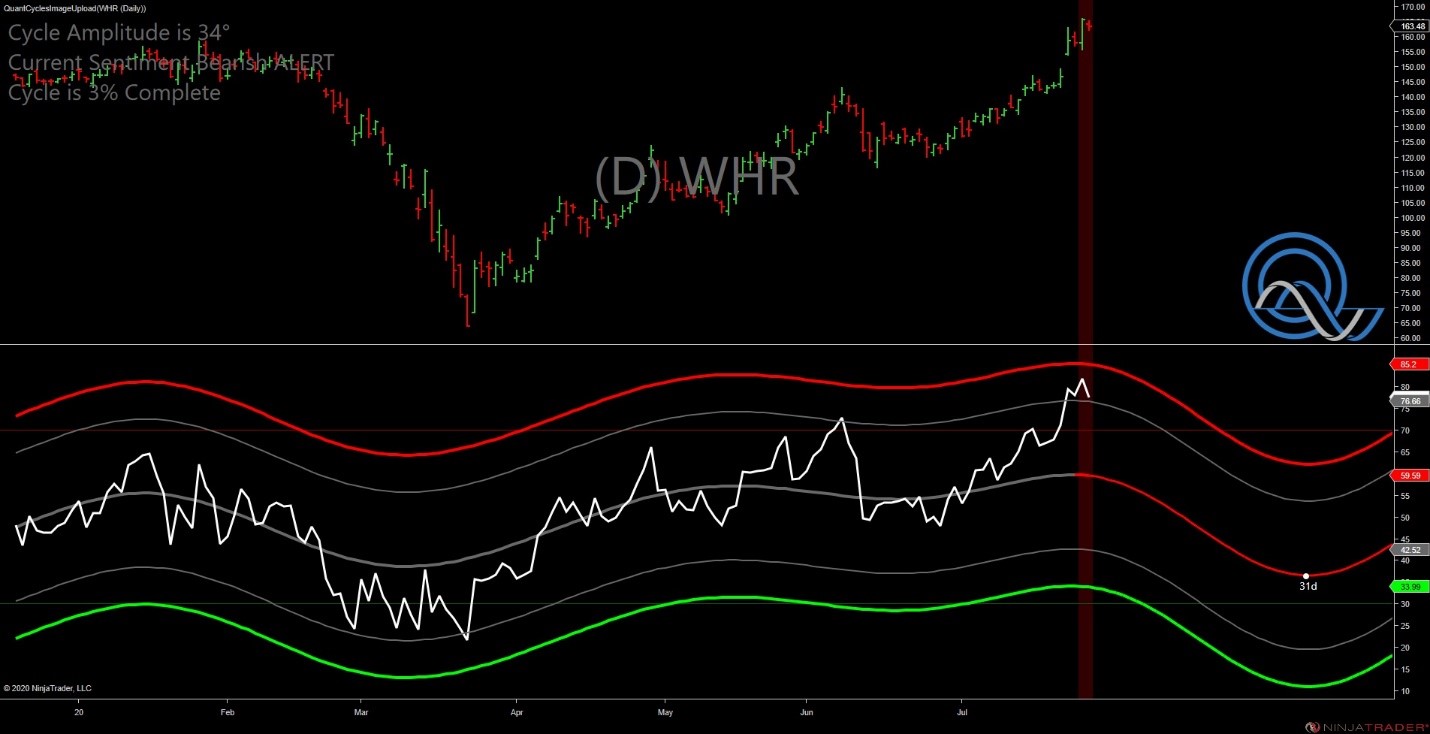
Drilling down a little, the daily QuantCycles Oscillator for WHR confirms both its overbought nature and a recent turn bearish—to last at least a month (see chart below).
Rarely does the QuantCycles Oscillator agree across short-, medium and long-term timeframes. When looking at the short-term (four-hour) WHR chart, we see a high level of confirmation with the daily and weekly (see below).
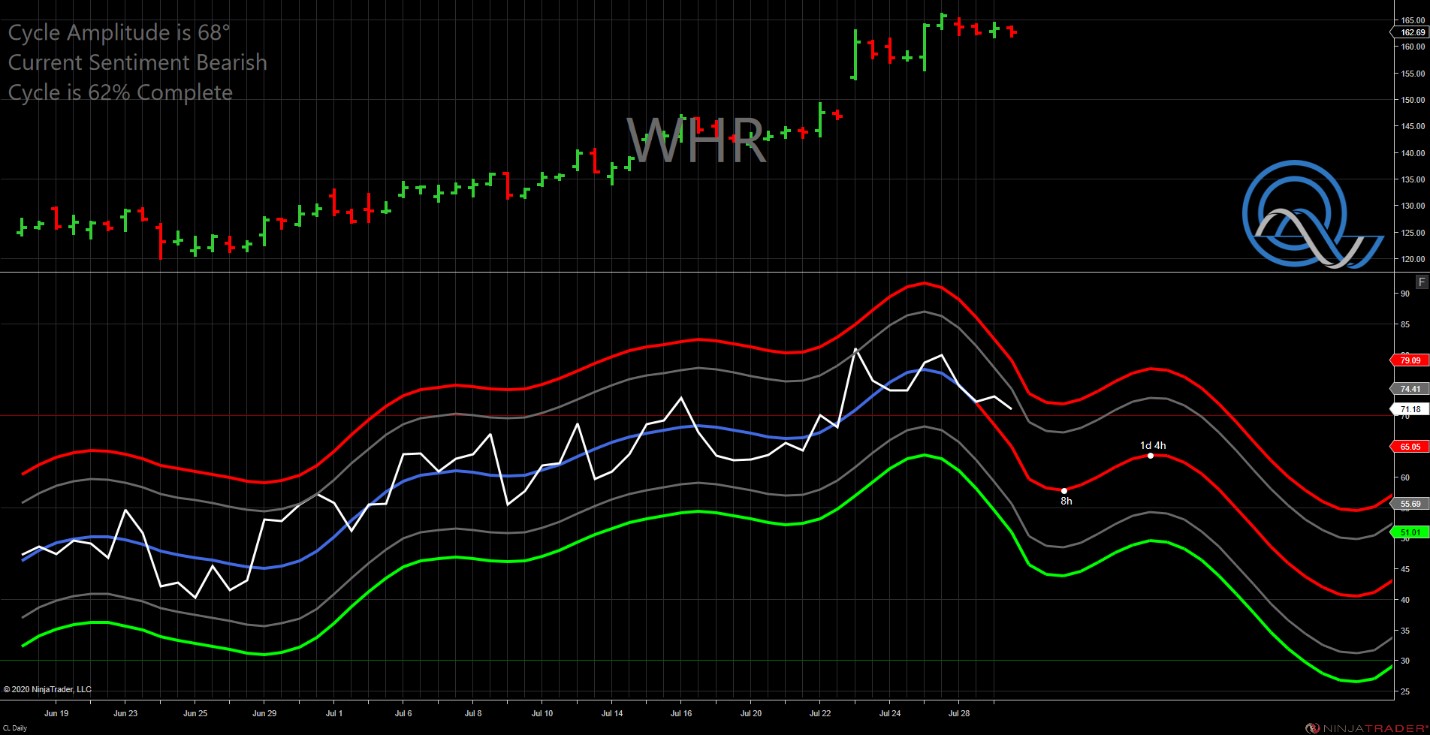
This is a rare confluence and a strong sell signal.
John Rawlins described the value of the QuantCycles Oscillator recently at The Orlando MoneyShow.
The QuantCycles indicator is a technical tool that employs proprietary statistical techniques and complex algorithms to filter multiple cycles from historical data, combines them to obtain cyclical information from price data and then gives a graphical representation of their predictive behavior (center line forecast). Other proprietary frequency techniques are then employed to obtain the cycles embedded in the prices. The upper and lower bands of the oscillator represent a two-standard deviation move from the predictive price band and are indicative of extreme overbought/oversold conditions.


