

Long-term Treasuries remain bullish with a slight chance of an correction, reports Al Brooks.
The U.S. 30-yer Treasury bond futures has rallied relentlessly on the weekly chart after a climactic reversal down in March (see below). This increases the chance of a sudden acceleration up.
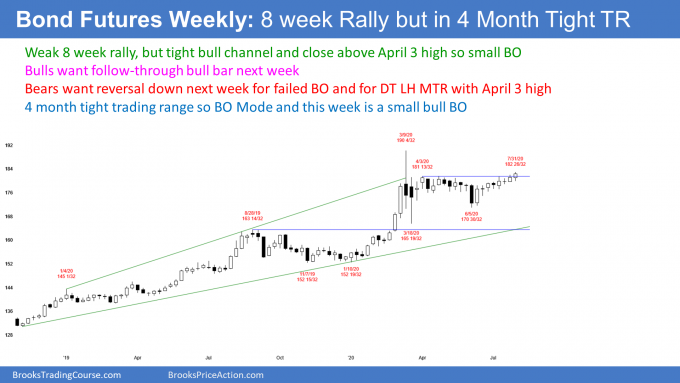
The 30 year T-bond market is relentlessly marching up in a nine-week bull micro channel. While the price increase has not been dramatic, the bulls are winning every week on the weekly chart. They keep getting a high above the prior week’s high and a low above the prior week’s low. This makes higher prices likely.
I mentioned last week that an unimpressive bull trend that is relentless often suddenly breaks to the upside. Traders should not be surprised if this were to happen.
I have pointed out several times that the rally from the 2019 low has had two legs up and it has been climactic. Climactic rallies tend to have a third leg up before they exhaust themselves. Consequently, even with the dramatic climactic reversal down in March, the bulls still have a 40% chance that the current two-month rally will make a new high. If it does, traders should expect a reversal down from a two-year wedge top.
Can the weekly chart reverse down next week? The first reversal down from a tight bull channel is typically minor. Therefore, the best the bears can probably get is a minor reversal down. That means a one- to two-week pullback. They will likely need at least a micro double top before they can reverse this nine-week rally.
Trading Room
Traders can see the end of the day bar-by-bar price action report by signing up for free at BrooksPriceAction.com. I talk about the detailed E-mini price action real-time throughout the day in the BrooksPriceAction.com trading room. We offer a two-day free trial.


