

While the bull trend in bonds has not been massive, its persistence is a sign of strength, writes Al Brooks.
U.S. 30-year Treasury Bond futures have worked higher relentlessly for eight weeks. Even though the price is not much higher, the persistence increases the chance of a bull breakout. Small but relentless trends sometimes accelerate into clear, strong trends.
Last week’s low on the 30-year Treasury bond futures weekly chart above the previous week’s low (see chart below). This is the seventh consecutive week with rising lows. There is now an eight-week bull micro channel on the weekly chart.
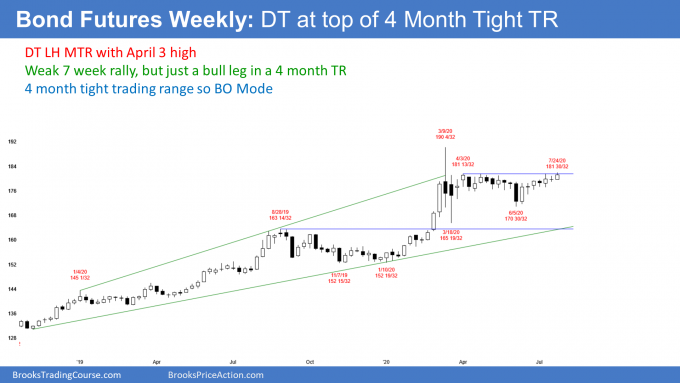
It’s not perfect because the low three weeks ago was three ticks below the low of the week before. But on the monthly chart, that is minimal. Most things in trading are less than perfect. But the closer they are to perfect; the more traders expect the market to behave like the perfect pattern. The rally is close enough to a micro channel to use that term.
While the price has not been rising quickly, the bulls have been persistent. It is important to remember that the chart is not just a price chart. It is two dimensional and time is the second variable. Sometimes time is more important than price. Time can occasionally tell traders that a trend is beginning before price makes it clear. This could be an example.
Possible short covering rally
When there is a bull micro channel with very little gain in price, the bears short what they think is a weak bull trend. But it is not weak. What often happens is that the shorts get squeezed and the bull trend accelerate up.
The bears see that there is a lot of room to the March high and they do not want a huge loss. They become concerned by the persistent drift upward and buy back their losing shorts.
A bull micro channel often leads to an acceleration up due to short covering. Consequently, there is an increased chance of a near-term bull breakout above the eight-week bull channel.
Monthly chart has High 1 bull flag
I talked about June being a pullback from the rally to the March high. That made it a High 1 bull flag buy signal bar (see chart below). July triggered the buy by going above the June high. July is therefore the entry bar.
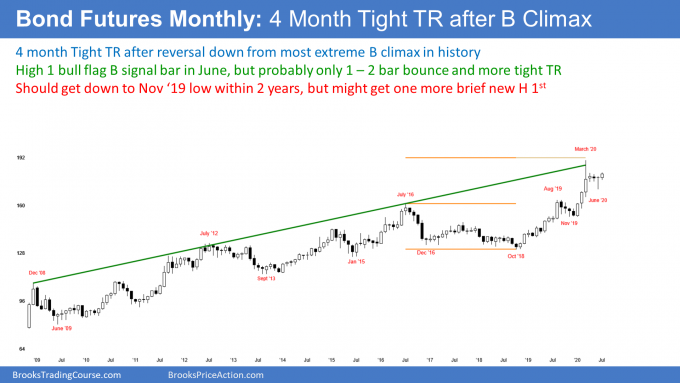
With one week remaining in the month, July is a bull bar closing above its midpoint. While it is not a big bull bar, if it looks like this when the month closes on Friday, traders will expect at least slightly higher prices in August.
As climactic as the January to March rally was, it was still only a second leg up. Buy climaxes often end as wedge tops, which means a third leg up. The bulls are hoping that June was the start of the third leg up to above the March high.
But unless either July or August is a big bull bar closing near its high, the two-month rally will more likely form a lower high. The odds are that the March buy climax was extreme enough to lead to a yearlong trading range and not just a three-month pullback.
Is sell signal, now a buy?
June broke below an Inside-Inside (II) pattern on the monthly chart after the reversal down from the March buy climax. April and May were consecutive inside bars, which is a Breakout Mode pattern. The sell signal triggered when June traded below the May low.
The bond futures this week broke above that II. When an II sell signal fails like this, the breakout above it, is then a buy signal. In addition to the High 1 bull flag in June, there is now an II buy signal in July.
That could be what the bulls need to accelerate up above the weekly bull micro channel. But if instead the bonds turn down next week, there would be a micro double top with the April high. This would be second sell signal (the II was the first). Traders should find out within the next two weeks.
Trading Room
Traders can see the end of the day bar-by-bar price action report by signing up for free at BrooksPriceAction.com. I talk about the detailed E-mini price action real-time throughout the day in the BrooksPriceAction.com trading room. We offer a two-day free trial.


