

Moody’s has a bull set-up while the broad financial sector is looking weak, reports Daniel Collins.
With the Federal Reserve buying up all types of bonds—corporates as well as Treasuries—one might wonder about the value of a ratings agency. With the Fed backstopping everything, should all bonds be AAA?
We are only half joking with that, but it comes to mind especially as we look at the performance of top ratings agency Moody’s Corp. (MCO).
Moody’s has been in the midst of a monthlong correction after taking out its all-time high from February in early July. The correction has been minor, roughly 7%, after MCO took recovered all its losses from the Coronavirus sell-off, plus some. Perhaps more impressive is Moddy’s performance vs. the broad financial services sector. The Financial Select Sector SPDR Fund (XLF) is still more than 15% below its February high.
Oddly, the XLF and MCO have been moving in different directions this past month. Perhaps it is a course correction but could create a possible pairs trade.
With Moody’s long-term strength, the recent correction has created an opportunity for traders to get back in at a price.
The weekly QuantCycles Oscillator for MCO is in the midst of a long uptrend and the recent correction has pushed it near extreme oversold territory (see chart below).
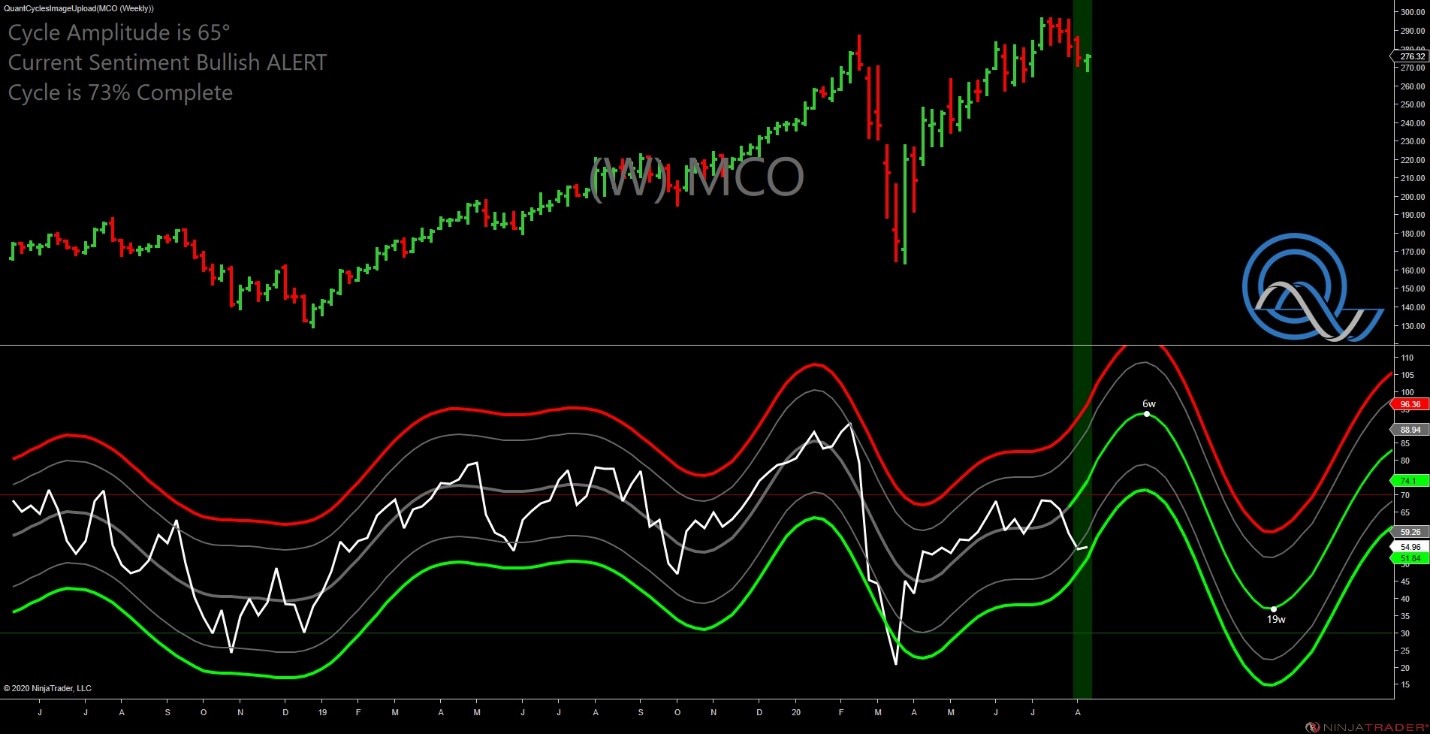
This is an extremely bullish set-up. While the weekly osccilator shows another six weeks of uptrend, the daily oscillator shows a smaller window of opportunity (see chart below).
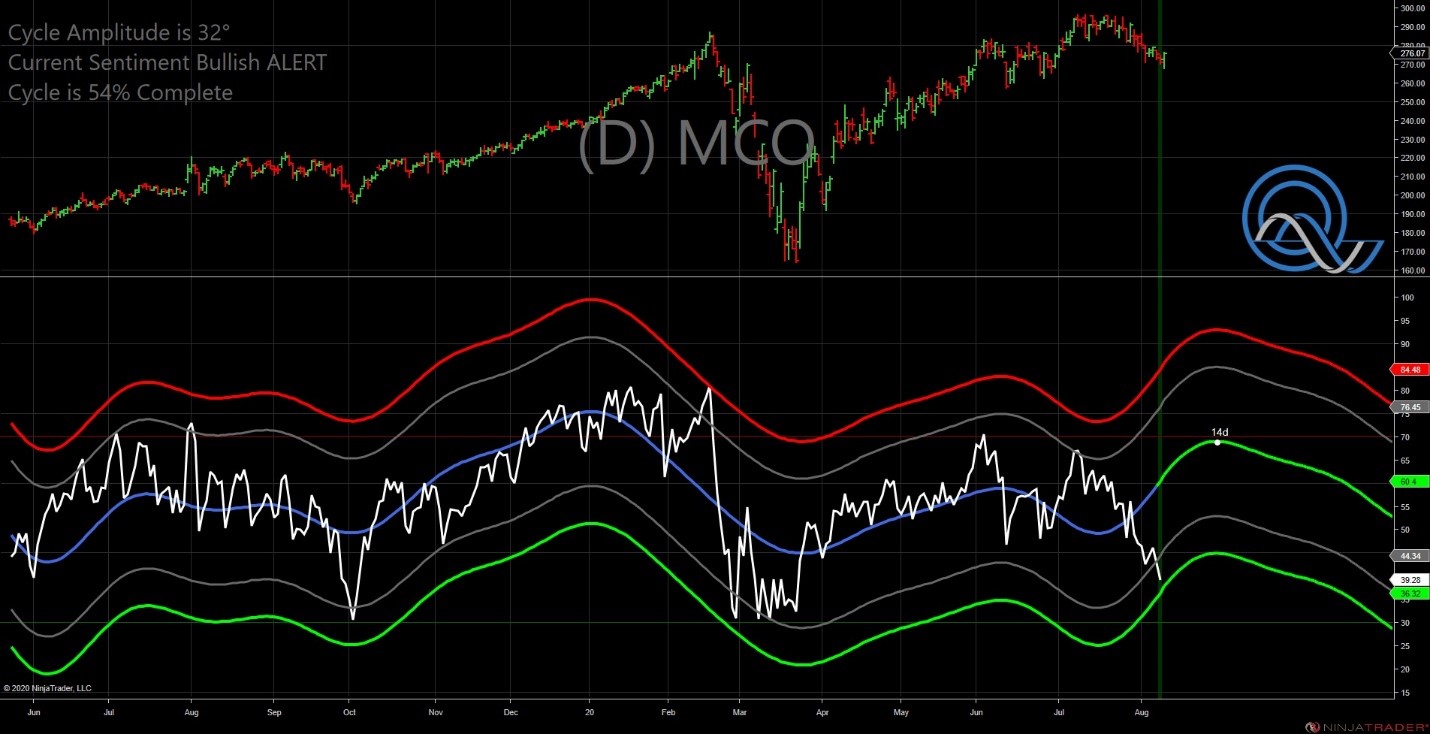
The daily oscillator clearly confirms what appears in the weekly—MCO is in a bullish uptrend while sitting near extreme oversold territory—but it only expects two week of uptrend. This is not really a conflict, though one may want to place stops accordingly. It makes sense to pay attention here as the weekly is predicting a sharp up move following the current cycle.
We mentioned above that Moody’s has recently been moving in the oppostie direction than the XLF ETF.
XLF has been moving higher as is noe near overbought territory. It is overbought while the QuantCycles Oscillaror is pointing lower (see chart below).
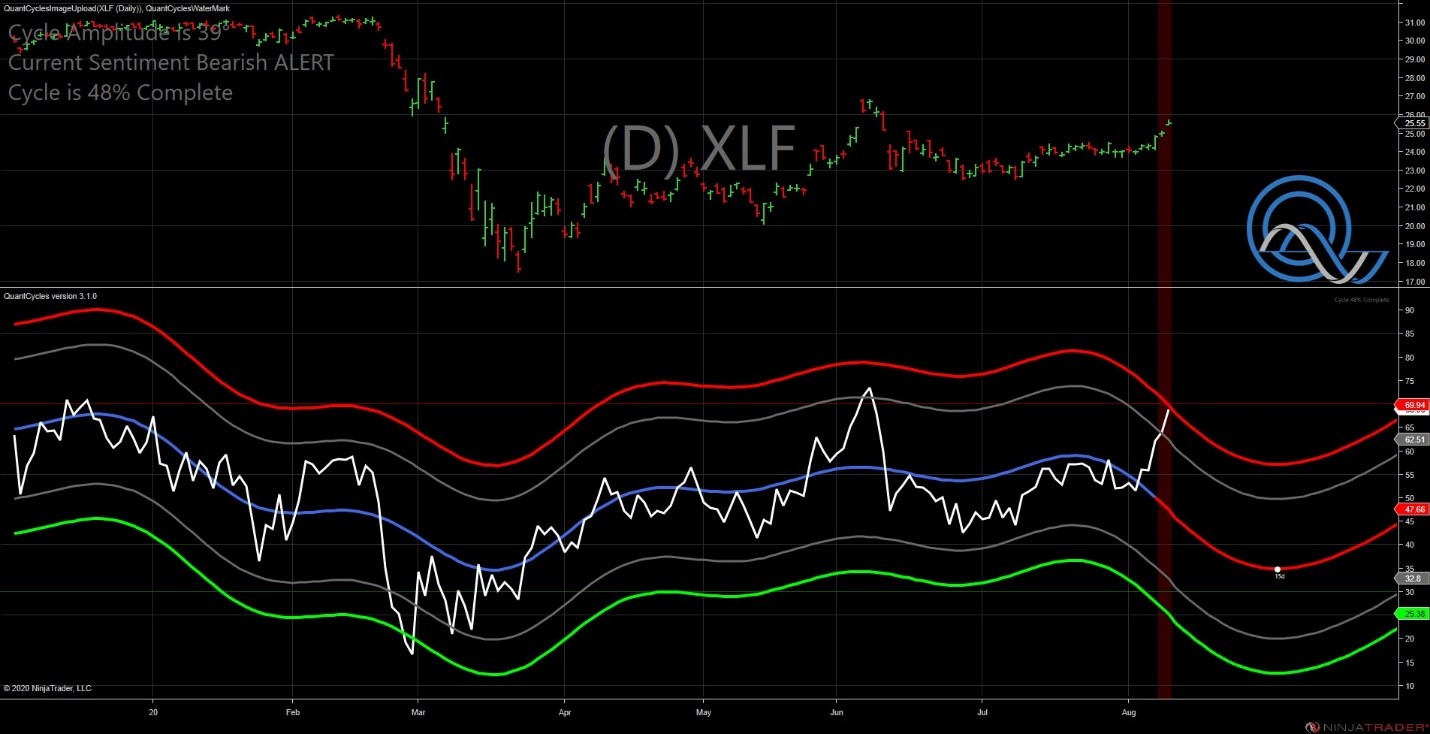
The oscillator is giving a sell signal in XLF. But a better option—given the related sectors and divergence in moves and expectations—may be a pairs trade. Buying Moody’s while shorting the broad Financial sector could be a strong move given this divergence.
John Rawlins described the value of the QuantCycles Oscillator recently at The Orlando MoneyShow.
The QuantCycles indicator is a technical tool that employs proprietary statistical techniques and complex algorithms to filter multiple cycles from historical data, combines them to obtain cyclical information from price data and then gives a graphical representation of their predictive behavior (center line forecast). Other proprietary frequency techniques are then employed to obtain the cycles embedded in the prices. The upper and lower bands of the oscillator represent a two-standard deviation move from the predictive price band and are indicative of extreme overbought/oversold conditions.


