

Al Brooks says bonds will continue to bounce back from early August weakness, but traders should expect a second leg down.
U.S. 30-year Treasury bond futures are bouncing after last week’s selloff. Traders should expect a second leg down to the June 16 low to begin within a couple weeks.
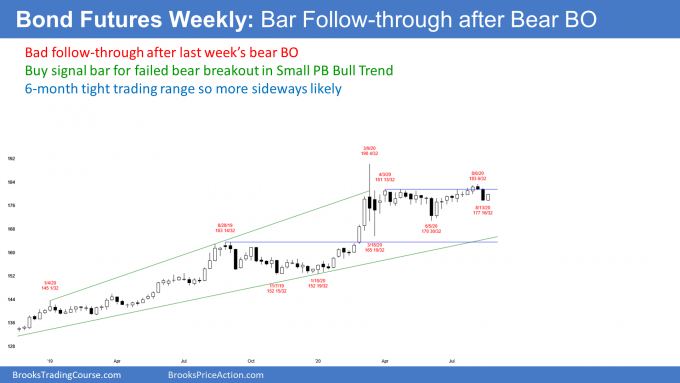
The weekly bond futures chart has been sideways for five months (see chart below). Traders expect reversals. When there was a downside breakout in June, the market reversed up the following week. The bull breakout earlier this month reversed down.
The previous week broke below a two-month bull channel, while last week did not completely reverse the selloff, it was a bull bar. Traders are unwilling to hold onto positions because they think the trading range will continue. They buy low, sell high, and take quick profits.
Last week’s selloff retraced about half of the two-month rally. The bulls hope it will be just a pullback in a Small Pullback Bull Trend since the June low.
Because last week was a bull inside bar, it is a buy signal bar for this week. However, the previous week fell far below the two-month bull trend line and this week only erased about half of that selloff. That increases the chance of at least slightly lower prices. You can see the reason for a second leg down on the daily chart below.
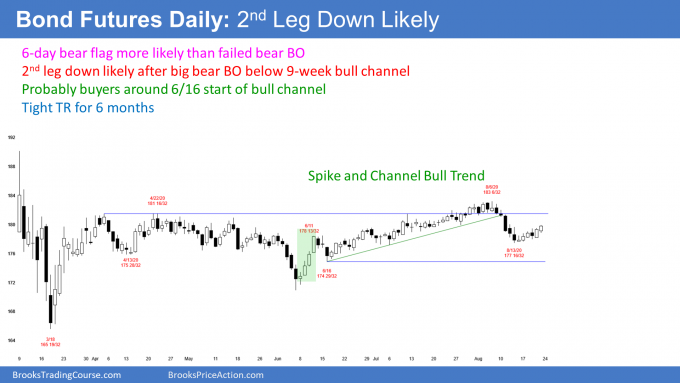
The daily chart rallied in a Spike and Channel Bull Trend since June. The four-day rally that ended on June 11 was a Spike up. There was a three-day pullback to the June 16 low. The bull trend continued up for two months in a bull channel.
Traders expected a break below the bull channel because that is what happens 75% of the time. Next, they look for two or more legs down to where the channel began.
There has only been one leg down from the August high. Furthermore, the selloff has not gotten close enough to the June 16 low to convince traders that the test down is adequate. Consequently, last week’s rally on the daily chart is probably a bear flag. There should be another leg down to around the June 16 low.
At that point, traders will expect a bounce. The bonds bounced there in June. Traders suspect the bonds will do the same this time.
The result is that the selloff below the bull channel usually leads to a trading range. That is what typically happens when there is a Spike and Channel trend.
Since the entire pattern is within the six-month range, traders are already expecting more sideways trading, possibly for the remainder of the year.
Trading Room
Traders can see the end of the day bar-by-bar price action report by signing up for free at BrooksPriceAction.com. I talk about the detailed E-mini price action real-time throughout the day in the BrooksPriceAction.com trading room. We offer a two-day free trial.


