

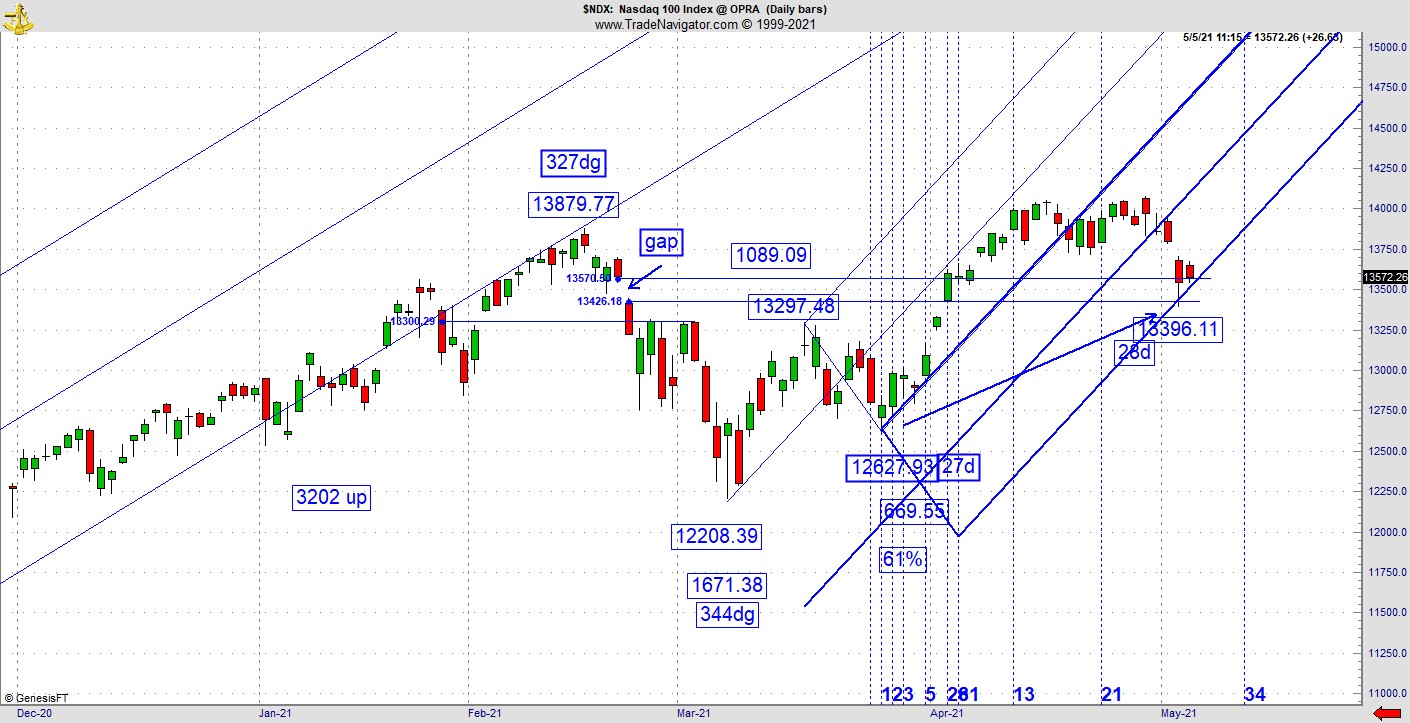
We’ve been looking at one point on the NASDAQ-100 (NDX) since February 22. Once we hit that gap down, I thought it could be retested before the real correction started, explains Jeff Greenblatt of Lucas Wave International.
Well, it wasn’t much of a correction. Consequently, the pattern broke through to the upside. Guess what level is being tested again?
When I put the magnifying glass on this pattern, we see the latest leg of the rally kicked off with a low of 12627.93 and it was the 27th day off the top. Now it has gapped down on the 28th day from the 27-vibration low. Do you think that’s a coincidence? You don’t have to know anything about price and time square outs to realize the pattern has a memory and this all-important level on the chart is getting tested yet again. Not only that, when I add the parallel channel to the original, the uptrend is holding by a thread. If it holds, we can get a sustained leg up as some have said. If it doesn’t, the market could be giving us a clue the rally is done.
While we are talking about holding the line, here’s an update on Citigroup Inc. (C), which was discussed here in-depth last week. I reported this one was likely to go but would encounter trouble as it hit overhead resistance in the form of the gap, which needed to be retested. This is exactly what happened. What was surprising is the pattern elected to stall at the earliest possible point in relation to that gap. It did back off but did not give up.
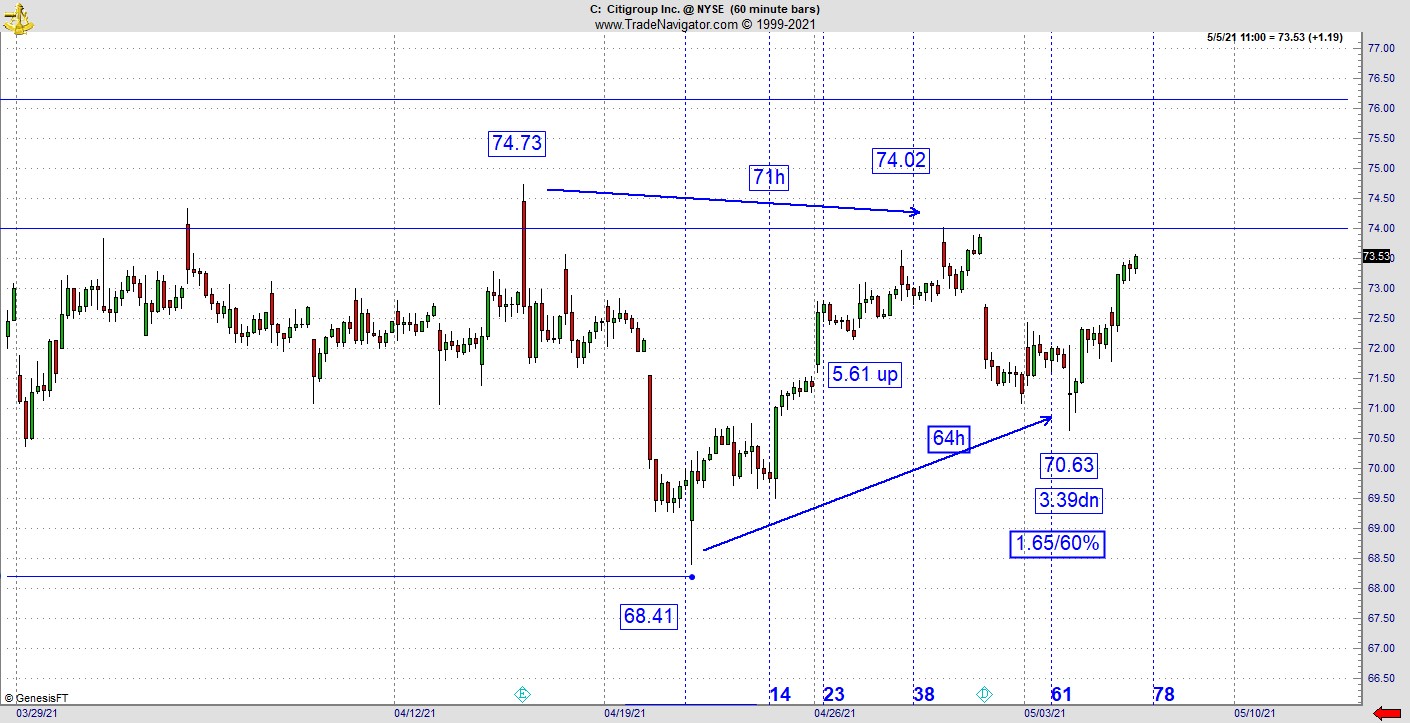
Let’s take a look at the situation on Wednesday. Starting with the hourly chart, the action stalled at 74.73 and retested at 74.02 at 71 hours, which is a 2 margin of error (.73 and 71 hours). This leg up was 5.61 and it pulled back 3.39. This has a slash line (retracement value/inverse retracement value) of 60% and 1.65. Both are equally important, and it takes one other vibration as a match for it to get interesting or offer a buy signal. From low to higher low its 64 hours, which lines up with the 1.65 aspect of the slash line. As an aside from the reason we are all here, which is to make money, isn’t market precision simply amazing?
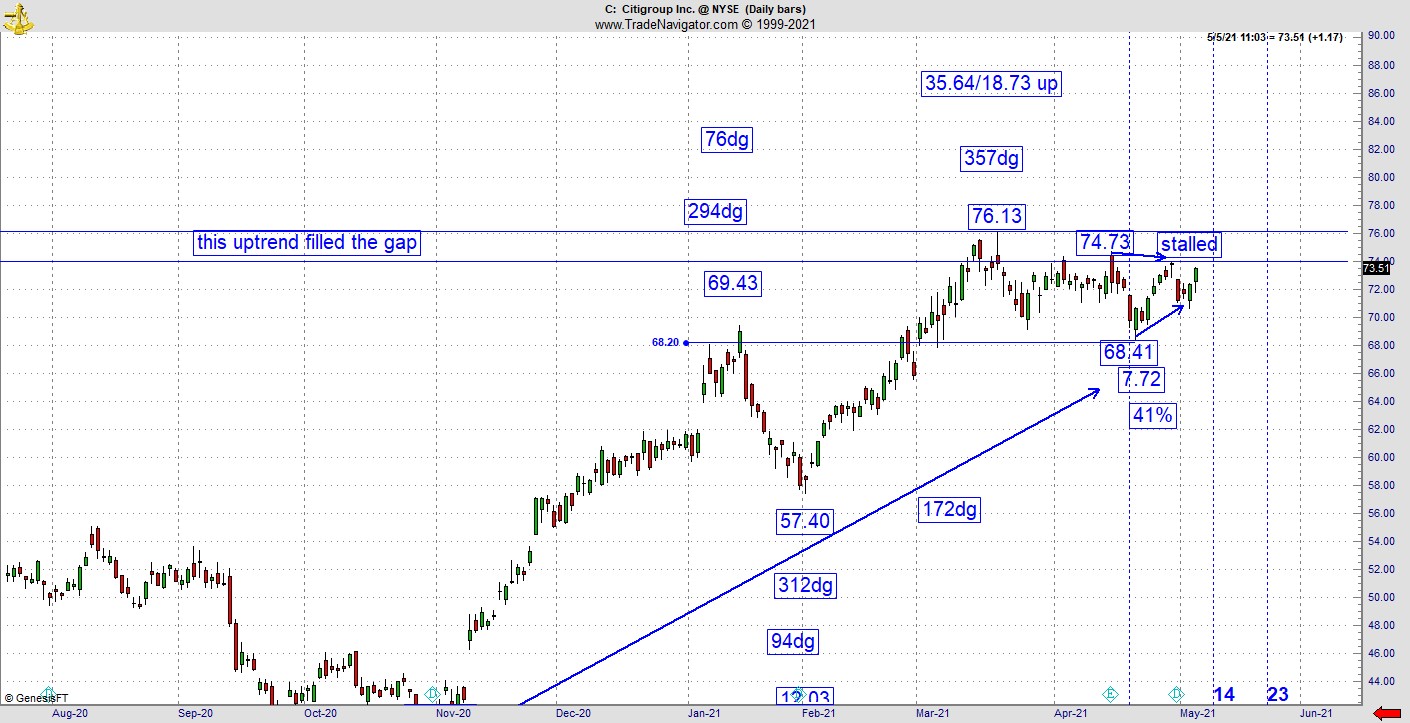
I know I’m showing you this late as I do this update once a week, but this setup was already good enough to fill the smaller gap down. So, this one is also at a key inflection point, which could have a profound influence on the banking sector, which in turn would influence the overall market.
This is May and there is something to be said for the summer paint-drying season. Will they sell in May and go away? I’m not the only one looking at 2022 as a longer-term cycle point, which could bring a hard down wave. We are getting close and starting to run out of time. Let’s look at 20-year cycles for a minute. We had major lows in 2002, 1982, 1962, and 1942. Small sample size but if this sequence follows through, the selling is going to have to start soon or perhaps this cycle will not hold this time.
If we are to get that hard low next year, the longer the market fiddles around at these levels, the harder it will fall. I hear more intelligent people talking about a crash. I’m asked all the time if I think the market will crash. To be frank, any market crash is a low-probability event and it's not good business to attempt to predict one. My answer is the market usually crashes in the September/October time window. We know this year is unique because the US dollar will be sitting at 161 months off its 2008 bottom.
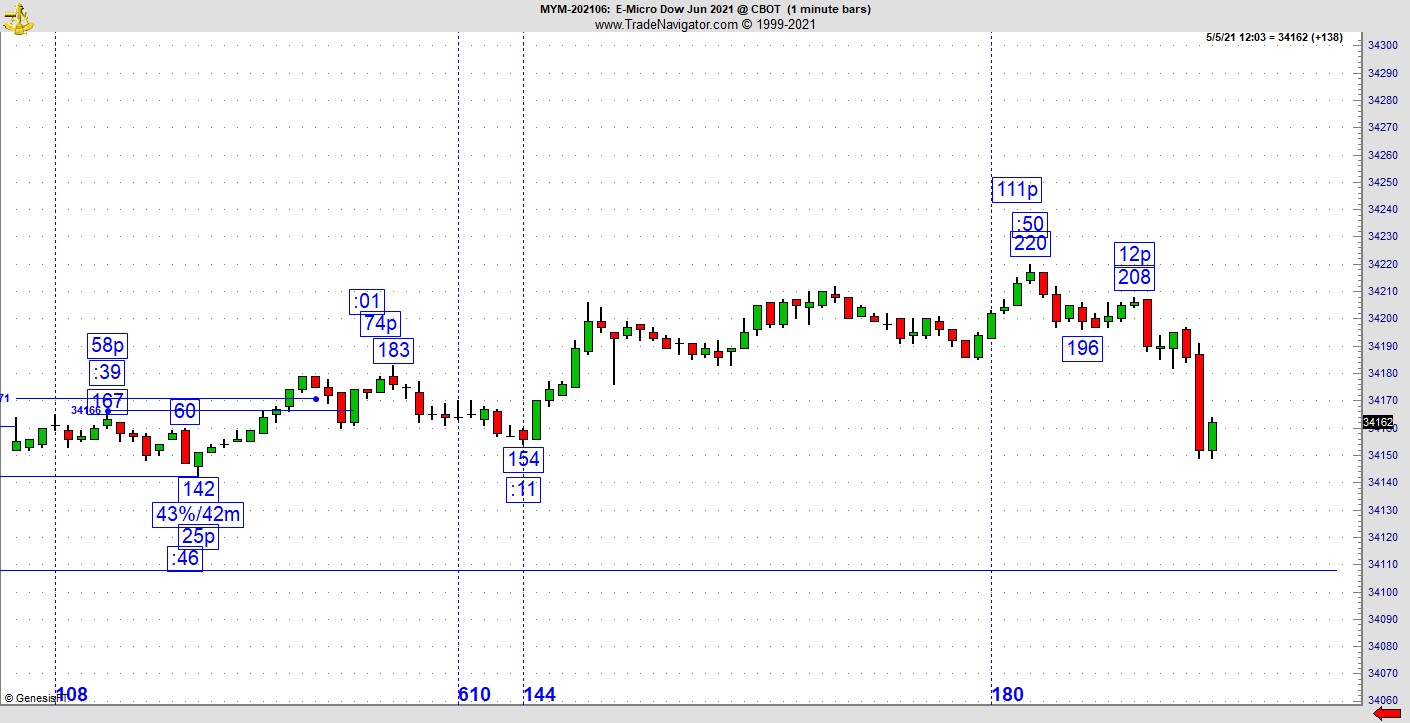
Finally, for those of you looking to catch a big wide range bar on your intraday futures trading, take a serious look at this vibration. The idea on intraday scalping is to stay with the move long enough to catch the wide range bar. Sometimes it comes early, mostly it requires patience and discipline.
On Wednesday’s MYM, there was a high at 34220, which was 111 points up. This one dropped 24 points and retraced 12 for a 50% retracement. What was the time stamp on the high? You can clearly see it was :50 after the hour. Do you think this is a coincidence? Not only that, but the 12-point rise clearly vibrates with the 111-point range (1 margin of error). From 208 it dropped to 149 in 5 minutes. I switched to the MYM when Covid started because I don’t have the stomach to deal with a 30–50-point risk level from the point of the pivot to where my side of the trade gets the upper hand. Another alternative to dealing with all the noise of the day session is to trade the overnight.
The overnight session is interesting as it doesn’t offer the chance for humongous gains, it also takes one out of the realm of dealing with large stop-out losses. The biggest difference between the day and night sessions is not only less noise, the pattern stays in the same direction for up to three hours at a time. Those of you who like to follow a trend and trade intraday might try it. One final caveat, be careful because the first hour is very tricky as it is in the day session. If you were wondering why the market has been running in place with smaller gains since April 1, the reason could be the overnight session seems to drop several hours at least three times a week, and it doesn’t show up on the daily bars in the cash market. With each new day, the market unwinds the bearish activity from the night before.
For more information about Jeff Greenblatt, visit Lucaswaveinternational.com.


