

The use of margin debt continues to climb in retail brokerage accounts as FINRA recently reported yet another increase of $25B in April (+3% from its March level), states Joon Choi of Signalalert Asset Management.
As I wrote in my last issue of Systems & Forecasts, in both 2000 and 2007 the stock market reached new highs a few months following sharp declines in margin debt as a percentage of GDP. In other words, investors had time after observing the decline in margin debt to prepare for the significant selloffs. The possibility of a stock market top looming must be unnerving, especially for those who are near or at an early stage of retirement. In this article I will discuss the Buffett Indicator and how active management is essential to mitigate significant risks in retirement.
Buffet Indicator
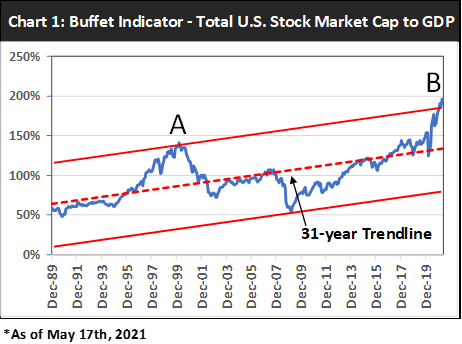
Warren Buffet’s favorite catchphrase is “be fearful when others are greedy” as he follows an indicator to gauge investors’ level of greed. The so called “Buffet Indicator” is a ratio of the US stock market capitalization (Wilshire 5000 Index) divided by the nominal GDP (Chart 1). I plotted its trendline (best-fit line) since 1990 and drew equal-distanced lines above and below to create a channel. Currently this ratio is above the upper channel (Point B), which is similar to March 2000 (Point A) when the stock market was then near its peak. Moreover, stock market cap is now at 195% of the most recent nominal GDP (not adjusted for inflation), whereas this ratio was 141% in 2000.
Lost Decade
2000 to 2009 is known as the lost decade because the most bench-marked equity index, the S&P 500 (SPX), lost nearly 1% each year during this period on average. People who retired near the height of the tech bubble were not able to make money from equity holdings in their portfolio. However, investment-grade bonds such as Vanguard Total Bond Market Index Fund (VBMFX) returned 6% per year during the lost decade. This meant that their bond holdings (which tend to be a higher share of investments at or near retirement) made up for the lack of return from equities. Thus, during this period retirees had a good chance of making 4% from their nest egg. This is significant because the well-known 4% withdrawal rule in retirement states that a retiree’s chance of having enough money for the next 30 years was 100% (based on historical data) if he/she limited their annual withdrawal to 4%.
The dilemma for people 65 and over in current environment is that investment-grade bonds only yield 1.32% annually barring any interest rate moves. If inflation picks up and the Fed is forced to raise rates earlier than anticipated, then bonds will not return much if anything at all. Even if the 10-year Treasury yield falls to zero, the maximum 10-year average return from investment-grade bonds will be approximately 2%, far short of the 4% rule requirement. This is why investors are forced to increase their equity exposure to make up for the return shortfall from the bond holdings.
What If You Retire at the Peak?
Due to a current overvaluation of stocks, many well-known money managers expect stocks to return 4-6% yearly for the next 10 years (some even predict no return at all), which is only half of the historical average of 11%. Therefore, one would need to own approximately 60% equities and 40% bonds to have a chance to achieve the 4% target during the next decade. Chart 2 below shows a hypothetical percent of a nest egg during the next decade if one retired at the height of the dot.com boom (March 2000). This example assumes a 4% annual withdrawal rate with yearly rebalancing to maintain the 60/40 split between equities and bonds.
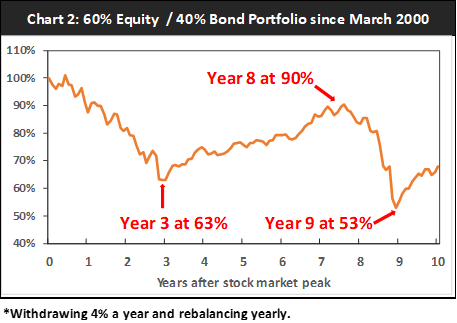
After the third year, your nest egg would have been down to 63% of the original amount and it would have been back up to 90% only if you stuck to the plan. The next year (2008) would have been tough as the stock market plummeted yet again.
Will You Run Out of Money? It’s More Likely If You Retire at the Wrong Time Without Risk Management.
In addition to the emotional duress of retiring near a market peak only to see your wealth decline precipitously, there is a financial risk of retiring at the wrong time. It is called the “sequence of return risk” and we can illustrate it with an example. Suppose Mr. Jones retires at age 65 at a market peak and immediately loses 1/3 of his nest egg in a bear market. After that loss occurs, he will have to withdraw 6%/year of his remaining nest egg rather than the 4% initially planned. That 6% withdrawal rate will burden his investments for the rest of his life, which for a married 65- year-old couple is another 25 years on average. Suppose Ms. Smith retires at age 65 at a more propitious time but suffers a 1/3 investment loss when she is 80. Even if Mr. Jones and Ms. Smith live to the same age and have the same average investment performance over their retirements, it is Mr. Jones who will be at greater risk of running out of money because his financial hit occurred earlier.
What that means is that a big hit to your investments near to or early in your retirement will make you more likely to run out of money than the same investment loss later on; the fear of investment loss right after you retire is rational.
Possible solutions to protect yourself against a financial hit early in retirement include:
- Retiring with more of a nest egg than you need to give you a margin of safety.
- Adopting investment strategies such as market timing that can potentially protect you from major market declines.
Conclusion
Although accurately forecasting equities’ long-term returns may be improbable, it is hard to imagine that we will enjoy double-digit average returns that we have seen in the past. Interest rates falling from the extremely high levels in early 1980’s to very low levels in recent years were a huge tailwind for equities as companies’ profits were buoyed by lower cost of money. However, interest rates cannot fall much lower from current levels, which puts a cap on further improvement in corporate profits. I strongly suggest seeking out active management services that focus on generating higher returns from risky bonds (i.e., high-yield bonds instead of traditional investment-grade bonds) and mitigating significant risks in the early stage of retirement.
¹ “Determining Withdrawal Rates Using Historical Data”. William P. Bengen. Journal of Financial Planning, October 1994 (pp. 14-24). The 4% withdrawal illustration in this article is different from the scenario that Bengan used. Here we studied an annual withdrawal of 4% of the portfolio value. Bengen analyzed outcomes (based on data from 1926-1992) from withdrawing 4% of the initial retirement nest egg and then withdrawing that dollar amount increased by inflation each year thereafter, regardless of the value of the investment portfolio. That is a higher hurdle to clear than withdrawing 4% of the portfolio each year.
To learn more about Joon Choi, please visit Signalalert Asset Management.


