

Although the S&P 500 Index is near record levels, it has been basically flat since April 15. Equity investors are lacking the conviction to push the broad index higher, states Joon Choi of Signalalert Asset Management.
However, the S&P 500 technology ETF (XLK) is down 4.6% whereas the S&P 500 financial ETF (XLF) is up 4.5% since mid-April as investors are rotating out of technology into the financial sector. A primary reason for this shift in allocation is rising long-term rates in anticipation of higher expected inflation. In this article, I will discuss how to utilize margin debt levels to identify broad equity corrections in advance.
Overview
The Financial Industry Regulatory Authority (FINRA) is an independent but government authorized agency overseeing US broker-dealers. FINRA collects the total month-end margin balances of customer accounts and traditionally publishes them on the third week of the following month. The most recent margin report was published on April 19 for March’s data. It stood at a new record level of $822 billion (an increase of $9B from the prior month). This figure is then divided by the Gross Domestic Product (GDP) to create a margin debt to GDP ratio (MD-GDP), which is currently at 3.73%; a historical high.
Analysis
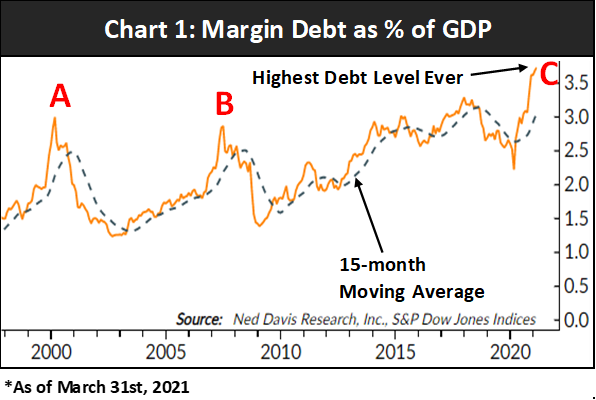
Chart 1 shows the MD-GDP ratio and its 15-month moving average since 1998. There are three instances where the ratio became extremely stretched from its moving average. The first occurrence was at the height of the dotcom bubble in 2000 (Point A). The second event was prior to the financial crisis in 2007 (Point B). Currently the MD-GDP is having its largest separation from its 15-month smoothing (Point C). Numerous articles on high margin debt have recently been in the news and most point out a dire picture of impending doom. However, I have not read about how one could use this indicator to determine when to lighten up equities other than by staying conservative.
Digging Deeper
After FINRA reported margin debt figures for December 2020 in the third week of January 2021, the S&P 500 Index erased all its month-to-date gains and proceeded to fall 3.6%, leading to a 1% drop for the month. The margin debt to GDP ratio had shot up 0.26% in December and may have scared off some investors. The problem with this type of overbought indicator is the possibility of selling too early and missing the upside potential, which is exactly what happened. Money managers who were scared by the high margin debt level were cautious early in the year. So how can you use the indicator to prevent a false signal?
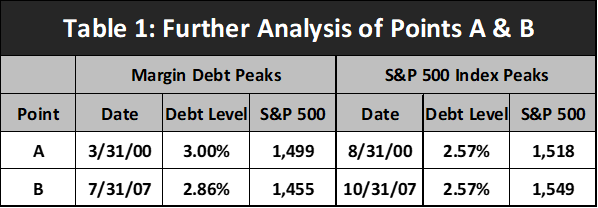
Table 1 displays the MD-GDP and S&P 500 Index levels during the past two margin debt peaks (Points A & B above). It also lists the S&P 500 Index peaks following the margin debt peaks. The significance of this finding is to highlight how margin debt peaked prior to the equity peaks. For example, MD-GDP peaked at 3% in March 2000 (data would have been available with three-week delay) but the S&P 500 monthly peak did not occur until five months later in August. By then, debt level had already dropped to 2.57%. The S&P 500 Index peaked three months after the margin debt peak in 2007.
Conclusion
Excess valuation in equities can be seen in many well-known metrics, such as Warren Buffet’s stock market cap to GNP ratio and Case Shiller’s CAPE Price/Earnings ratio. However, neither indicator has a sell trigger that safeguards against an early exit. The margin debt to GDP indicator may be utilized to lighten up on equities if it turns down in the coming months. The lead time seems to more than offset the three-week delay in the monthly margin debt readings. I will definitely keep an eye out and write further about this topic if I notice a downturn in MD-GDP ratio.
To learn more about Joon Choi, please visit Signalalert Asset Management.


