

To say this is a tricky market is like stating the obvious, explains Jeff Greenblatt of Lucas Wave International.
The Phoenix Suns let a championship slip away this week. Unlike the Suns, markets can and do recover. I mention the Suns because I live in Phoenix and the local townspeople were celebrating the championship as the Suns were up 2-0. Trading can be exactly the same way.
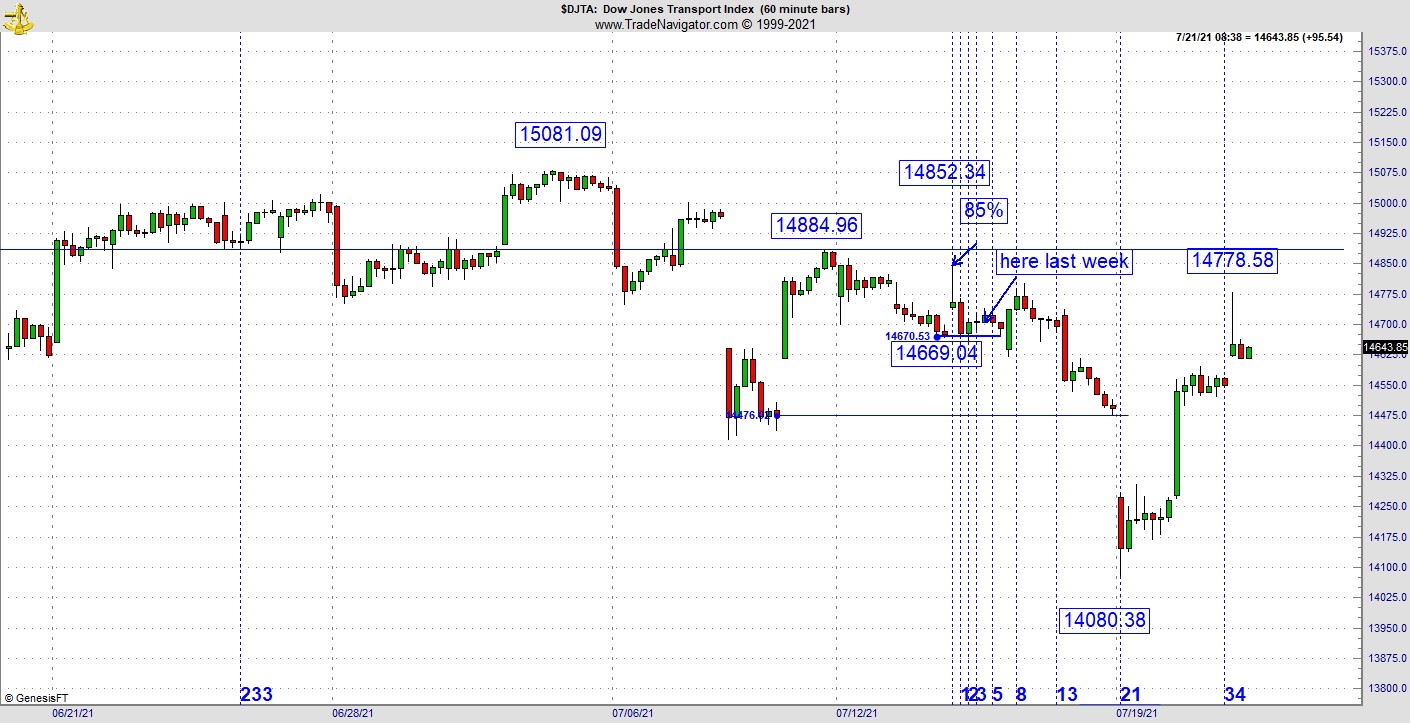
Don’t count your chickens before they hatch. Last week I showed you a very good vibrational setup in the Dow Transports. For those of you who are new, it’s the vibration that’s the signal. In this case, the hourly chart showed us a 14884.96 high, shall we round it to 885? On the very next sequence it left an upper tail at an 85% retracement. I knew something was going to happen. Why? Because a well-placed vibration is going to give the trader the greatest edge they could have. In summary, the bounce which commenced on July 8 failed in the gap, a key failure. Then it left an immediate upper tail on failed-gap weakness. That’s where we had our well-placed vibration. It faded, gapped down and then recovered.
Hopefully you weren’t like me, I was right about the pattern, but I also thought the Suns were going to win. As it is so often with the bearish side, it started recovering before anyone really figured out what was going on. This reminds me of the days after Brexit. If you recall, the entire world wanted to be short, and the market cooperated. But just as bears were settling in with their popcorn, the market turned and never looked back. No popcorn for me, I was warning there was a serious Kairos vibration on the SPX at that low.
So, let’s take an updated look at the Transports. The 85 vibration for the shorts? Most intraday or swing traders should’ve been satisfied with the gap down below support. Let me suggest it is a cardinal sin to give back gains like that. If you were crafty enough to be short something like the IYT, the pattern is similar, you need to protect those easy points which are hard to come by.
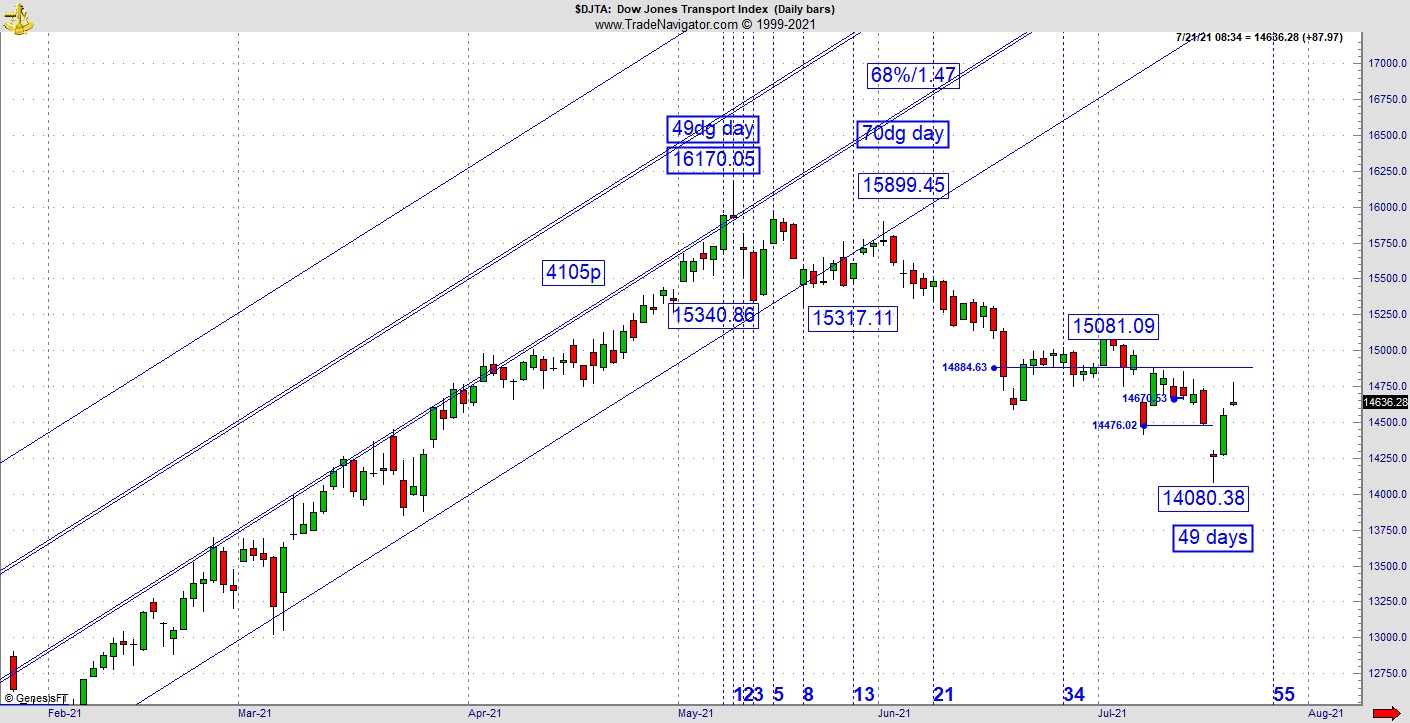
To understand what is going on here, one has to look to the Gann calendar. Here’s what happened. The high came in on May 10. It just happened that date was the 49dg vibrational day for the full year. In case you are new, the Gann year starts on March 22 and each day has a different vibration as the earth works its way around a full orbit of the sun. Since it's not a perfect circle, certain adjustments in the vibrational count are made along the way. I digress but just as bears were settling in, the chart turned at 49 days down from the 49dg day. I realize this is new for a lot of people, but this is how markets work. Gann worked this out nearly 100 years ago. What I’ve been able to do is take those vibrations and integrate them into the vibrational aspect of about any daily chart. Those who have been reading this column for a while should realize its efficacy by now. For the bear, all is not lost because the breakdown area is getting retested. For the bull, the news is interesting because they’ve more than filled that last gap down.
On Tuesday morning, I was having a discussion with a client about an interesting setup in the oil market. You’ll have to trust me on this one as Wednesday morning’s reaction was better then even I anticipated. On Tuesday oil found a low after an OPEC news event created a big bearish wide range bar. Were you already sitting back in your easy chair? Not in this market you don’t. Here’s what happened. From the low on May 21, the Gann calendar moved 58dg from the 61 low which was the 60dg day on my continuation chart. By itself, that doesn’t mean much. But when we see this pivot low was also a 58% retracement back to the seasonal change point low in March right near the start of the Gann calendar, suddenly the situation started to look interesting.
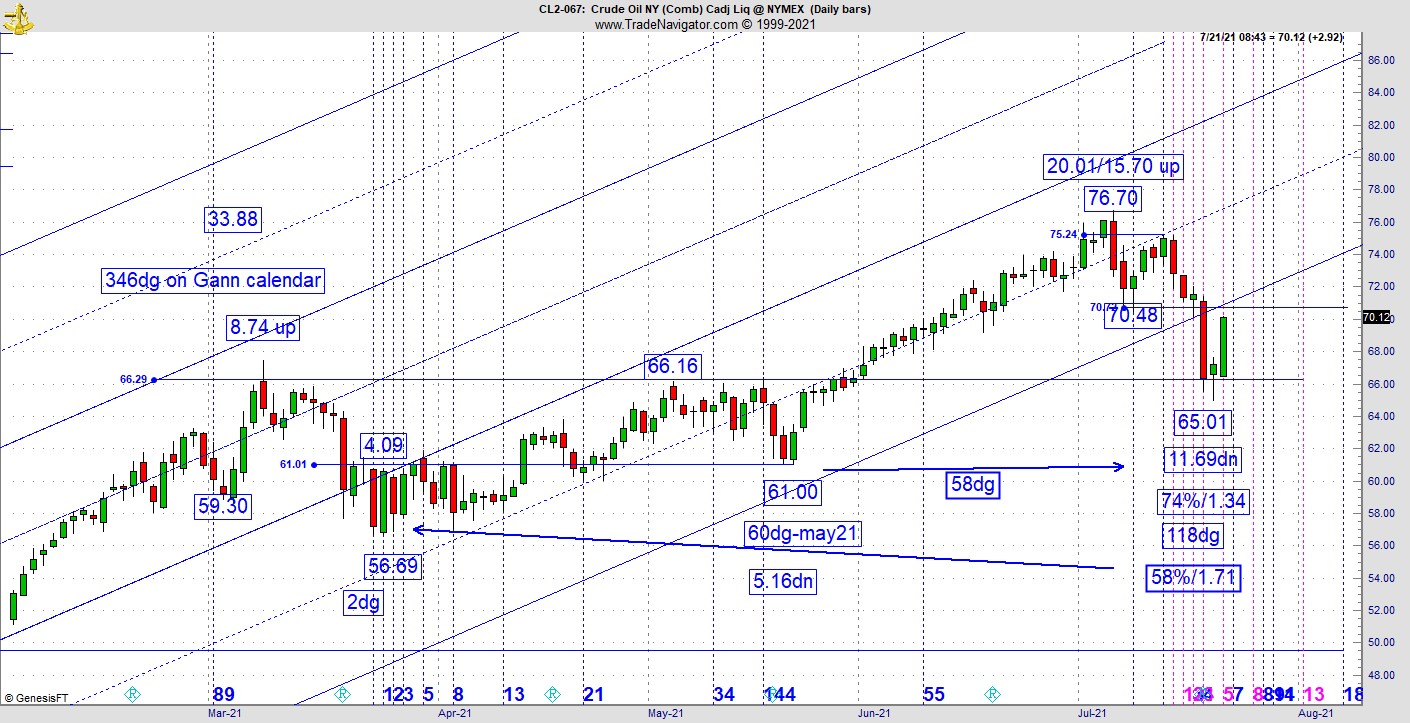
Want to be long oil? The 58-vibration low is remarkably interesting from another perspective as it came down to former resistance and now attempting to flip polarity. This is another well-placed vibration. But here’s the caveat. The breakdown on Monday took the action below support and now that exact area is being tested. To be bullish, I want to see a good secondary low form out of this situation. The reaction to these vibrations is a good start but we are in late July, just a few weeks from the traditional graveyard for stocks which is September. I’m not saying you shouldn’t attempt to go long but at this time of the year an extra layer of caution should be factored in if you are attempting anything more then a near-term swing trade.
There’s yet another reason this could be going up. While Bitcoin has been fading in recent days it appears to be making its final stand. So, here’s my bottom line. If the Transports and I should probably throw oil into this mix. If either one of these breaks support formed this week, it could a long way into changing the bias into being very bearish aggressive.
Finally, let’s take the socionomic test of the mood of the crowd. Several generations of traders have been able to connect the dots between social mood and the market. There is a correlation between hem size on a woman’s dress and an expanding/declining social mood. Miniskirts equate to bull markets, right? It was just announced the other day in the New York Post that Victoria’s Secret will eliminate the Angels from its stores. When the flagship Manhattan store reopens in a few days, all evidence such as posters, mannequins, and videos of the supermodels will be gone. To socionomic watchers, this should be a sign of a serious contraction in social mood. Perhaps this is the best reason of all not to get overly bullish these days.
For more information about Jeff Greenblatt, visit Lucaswaveinternational.com.


