

In quiet trading before the Labor Day holiday, defensive sectors led the way. Seven of the 11 S&P sectors finished higher for the week ending 09/3/21, states Bonnie Gortler of bonniegortler.com.
Seven stronger than the SPDR S&P 500 ETF Trust (SPY), up +0.63%. Real Estate (XLRE) +4.06%, and HealthCare (XLV) +1.65% were the leading sectors, while Energy (XLE) and Financials (XLF) lagged down -1.40% and -2.38%.
S&P SPDR Sector ETFs Performance Summary Week Ending 9/03/21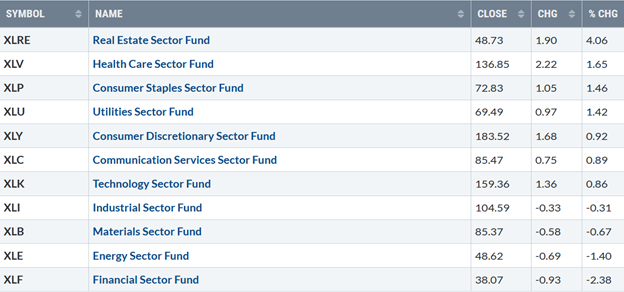
Source: Stockcharts.com
10-Year Treasury yields close at 1.32% last week, slightly above where it was last week, closing below mid-August resistance and below the July high of 1.42% (Figure1). A close above 1.42% could imply yields to test 1.55%.
Figure 1: 10-Year Treasury Yields 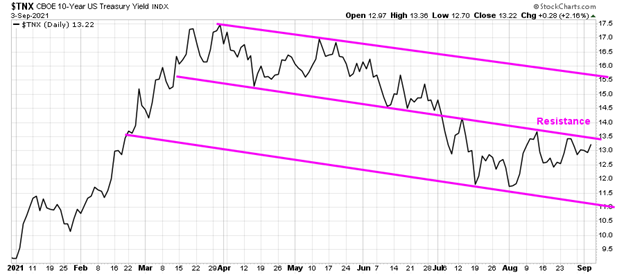
Source: Stockcharts.com
For the week, the Dow lost -0.24%, S&P 500 up +0.58%, and Nasdaq climbed 1.59%. The Russell 2000 index consolidated its recent week's gains, up 0.65%. Traders were disappointed on Friday when the Jobs report showed fewer new jobs than expected.
Market breadth was positive for both the NYSE and Nasdaq. The New York Stock Exchange Index (NYSE) had 2008 advances and 1481 declines. Nasdaq breadth was 2821 advances and 1897 declines.Figure 2: Daily New York Stock Exchange (NYSE) New Lows
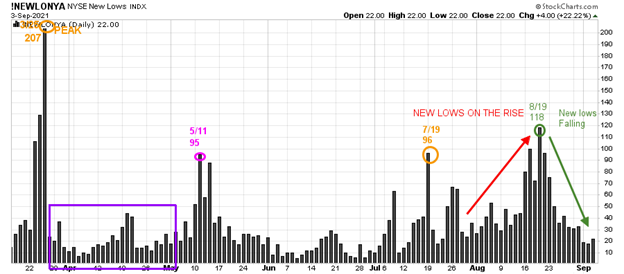
Source: Stockcharts.com
On 3/25/21, the NYSE new lows peaked at 207 (orange circle) and immediately contracted (purple rectangle), followed by a jump to 95 on 5/11, then contracting until 7/19, when they rose to 96 (orange circle). New lows then rose, peaking at 118 (green circle) on 8/19 above the low-risk zone. However, no further downside pressure followed as new lows contracted to 32 on 8/27
Watching new lows on the New York Stock exchange is a simple technical tool that helps awareness about the immediate trend's direction. Learn more in my book, Journey to Wealth. The market is very strong when the new lows are below 25 (very low risk, and prices tend to rise). When new lows are between 25 and 50, the risk is low, and prices tend to rise.
New lows closed on 9/3 at 22, favoring the bullish trend until new lows close above 150.
“Mastery requires patience.” James Clear
Bonnie’s ETFs to Watch Now
Figure 3: Performance week of 8/27/21 – 09/03/21 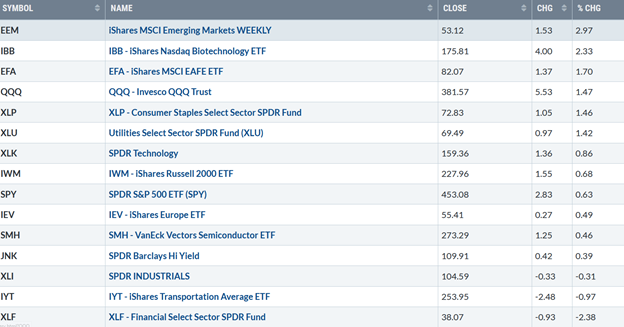
Source: Stockcharts.com
Positives
Hi-Yield (JNK) and open-end high yield corporate bond funds rose to new highs week (Figure 4). The Russell 2000 (IWM) consolidated after rising over 5% the previous week, closing above previous resistance of 225.00, now support. MACD is on a buy (Figure 9). The Nasdaq Daily AD Line broke the July downtrend (Figure 6). The weekly relative strength ratio to the S&P 500 (IWM/SPY) rises after a succession of lower lows with a flattening MACD (Figure 7). Nasdaq had 248 new highs, the highest reading since late June. (Figure 5). Emerging Markets (EEM) was strong for the second week in a row, gaining 2.97% after up over 4% the previous week, closing above its 50-Week MA.
Negatives
Transports (IYT) continue to underperform, lag the major averages, and remain in a downtrend since May (Figure 8). The Nasdaq-line AD-Line remains below where it broke down in July (Figure 7). September and October are volatile months, and historically when some of the worst bear markets have occurred. Market technicals of the Financial sector are giving warning signals of a pending decline (Figure 13).
Figure 4: LORD Abbett High Yield Fund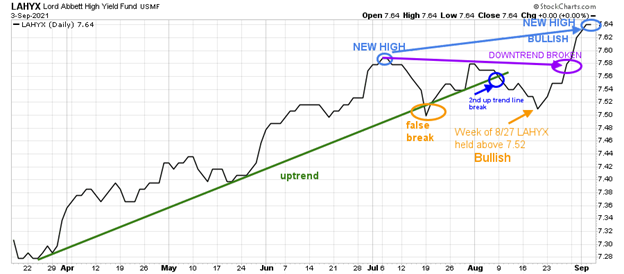
Source: Stockcharts.com
Lord Abbett High Yield, an open-end high yield corporate bond fund, broke its uptrend in July but turned out to be a false breakdown and has recovered to make a new high.
High-yield mutual funds and high-yield ETFs such as HYG and JNK recovered their July losses and now are at or near their all-time highs. Continued strength in high-yields is positive for the broad market. However, if they take out the July low, it will signify that trouble lies ahead.
Figure 5: Nasdaq New Highs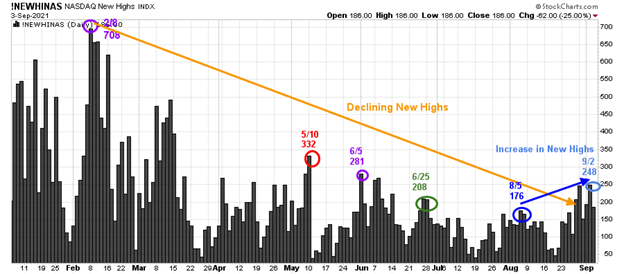
Source: Stockcharts.com
It's positive more Nasdaq stocks made new highs last week, the highest since late June (light blue circle). Although the Nasdaq is at an all-time high, new highs remain well below the peak reading of 708 set on 2/8. Watch if new highs expand to over 332, which would be positive for the short term, or if they begin to contract, then the rally is likely to fizzle.
Figure 6: Daily Nasdaq Advance-Decline Line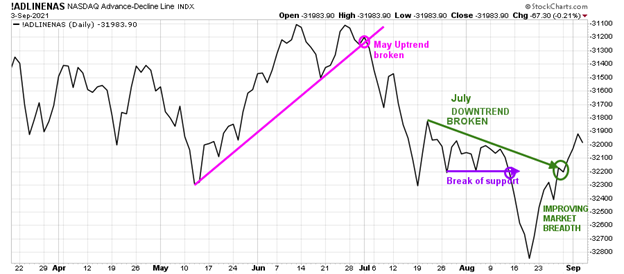
Source: Stockcharts.com
The Daily Nasdaq-line AD-Line broke down in July but has strengthened the past two weeks breaking the July downtrend. Continued positive breadth through the July highs would be favorable.
On the other hand, negative breadth would signify the Nasdaq rally could stall. If there is a pullback in Nasdaq, watch the AD-Line if it holds above the August low or violated, then expect weakness in Nasdaq to follow.
Figure 7: Weekly Nasdaq Advance-Decline Line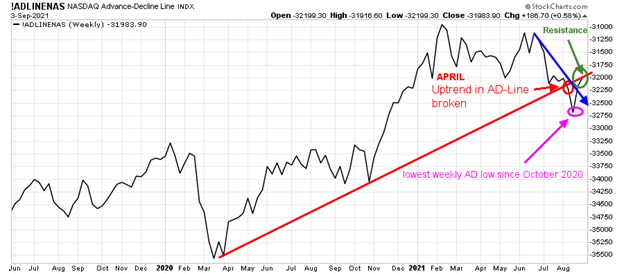
Source: Stockcharts.com
The Nasdaq-line AD-Line had closed at its lowest low since October 2020. The improvement in the AD Line stopped at resistance. Consider the rally in Nasdaq suspect until it closes above where it broke down in July (green circle).
Figure 8: Transportation Average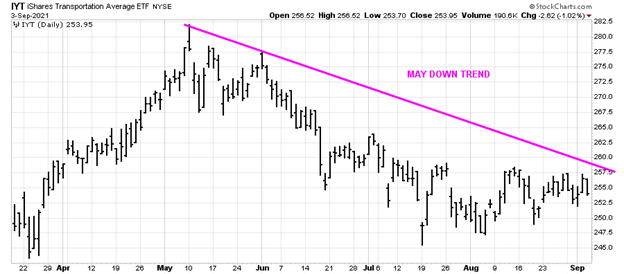
Source: Stockcharts.com
Transports (IYT) continue to lag and remain in a downtrend since May.
Figure 9: Daily iShares Russell 2000 (IWM) Price (Top) and 12-26-9 MACD (Bottom)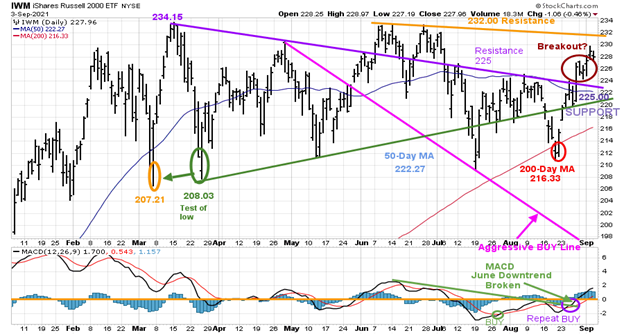
Source: Stockcharts.com
The top portion of the chart is the daily iShares Russell 2000 Index ETF (IWM), the benchmark for small-cap stocks, with a 50-day moving average (MA) (blue line) and 200-day moving average (MA), that traders watch and use to define trends.
IWM made a low on 3/5 at 207.21 (orange circle), then peaked at 234.15, followed by a decline to 208.03, successfully testing the March low. In June and July, IWM, after successive attempts to make a new high failed near 232.00 and turned lower but did not take out the March low.
Early August, IWM had lagged the major averages. However, IWM came to life at the end of the month, clearing resistance at 225.00 and closing above its 50-day MA. A close above 232.00 previous resistance would confirm the breakout.
A retracement between 222 and 225.00 remains possible and is still considered positive. However, a close below 216.33, the 200-day moving average, would imply the breakout was unsustainable and a decline to 197.50
The bottom half of the chart is MACD (12, 26, 9), a measure of momentum. MACD is on a buy and recently broke the June downtrend, a positive sign a test of the old high is likely. On the other hand, a turn down below 0 would be negative.
Figure 10: Weekly iShares Russell 2000/S&P 500 (IWM/SPY) Relative Strength Ratio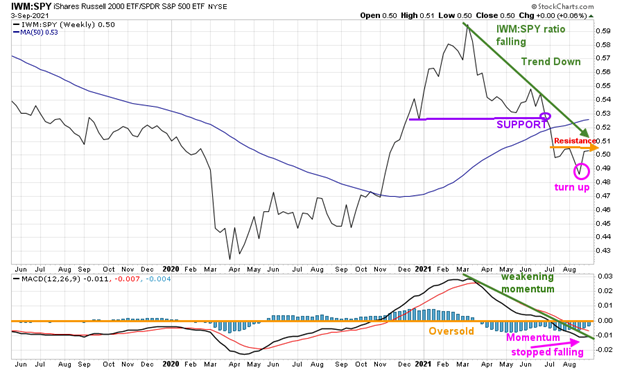
Source: Stockcharts.com
The weekly IWM /SPY ratio fell below support in June (purple line). With the last two weeks of gains in IWM, the IWM /SPY ratio turned up. However, it closed at July resistance, not yet breaking the July downtrend, and remains below the 50-week moving average (MA). MACD (in the lower chart) stopped falling to new lows, flattening, a positive sign. A turn-up and trendline break would imply further strength.
Figure 11: Weekly iShares Russell 2000 (IWM)
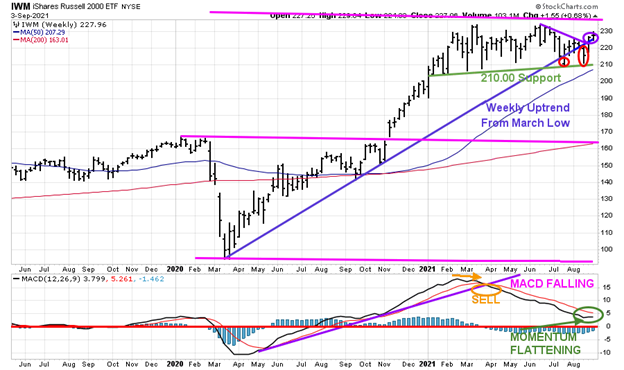
Source: Stockcharts.com
The Russell 2000 (IWM) (top chart) weekly support remains at 210.00. Resistance is at 232.00. MACD (lower chart) remains on a sell, not yet oversold, below 0, (red horizontal line) in a favorable buy position, showing that downside momentum has subsided.
Figure 12: Daily Invesco QQQ Trust Nasdaq (QQQ) Price (Top)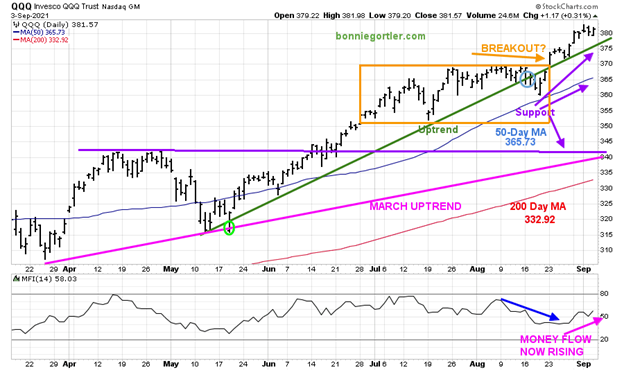
Source: Stockcharts.com
The chart shows the daily Invesco QQQ (QQQ) , an exchange-traded fund based on the Nasdaq 100 Index with its 50-day moving average and 200-day moving average. The March Uptrend remains intact (pink line). Since June, QQQ was in a trading range (orange rectangle) and then broke out to the upside. The upside objective is 390.00.
Short-term support is at 375.00, followed by 370.00, where the QQQ broke out. A close below 370.00 would imply a test of 350.00 followed by 340.00. It's a positive sign that money flow (lower chart) is no longer falling and has turned up, confirming the breakout in QQQ.
Any close below the March uptrend would likely hit sell stops to test the 200-day MA, which stands at 332.92 at this writing. As long as QQQ closes above 370.00, the bulls are in control.

Signs of potential trouble in the financial sector in the intermediate term?
Figure 13: Weekly Financial Select Sector SPDR (XLF) Price (Top), XLF/S&P 500 (XLF/SPY) Relative Strength Ratio (Middle) and Weekly 12-26-9 MACD (Bottom)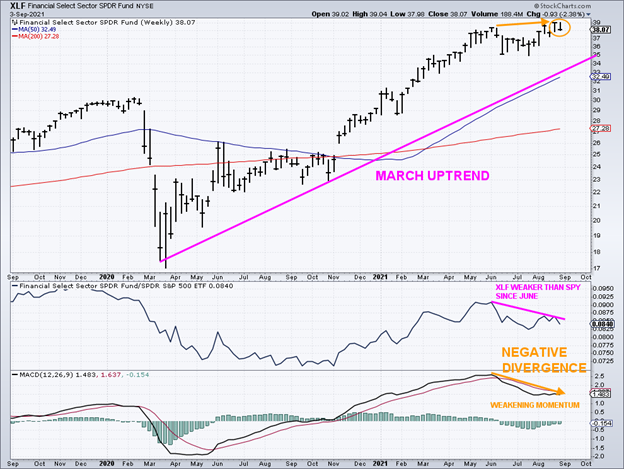
Source: Stockcharts.com
Financials have gained 30.23% in 2021. However, leadership may be coming to an end, and further gains are in question. The latest technical action is worrisome and bears watching.
On 9/3, XLF (top chart) closed at its low after closing the previous week at its high (orange circle). In the middle chart, the Financial Sector (XLF) is weaker than the S&P 500.
Notice how MACD momentum is weakening in the lower chart, forming a negative divergence, a potential shift in trend. A negative or bearish divergence forms when the price makes higher highs, and MACD makes a lower high.
Financials have been leaders of the advance, but the risk of a leadership change is forthcoming.
Summing Up:
Nasdaq led the market higher while the Russell 2000 consolidated after coming to life the previous week. Defensive sectors are gaining the interest of investors. Financials are losing momentum, implying their leadership may be coming to an end sooner rather than later. Risk management remains important despite no significant pullback in the S&P 500 this year. The bulls remain in control for now. However, September and October tend to be volatile months and could bring the bears out of hibernation at any time
Remember to manage your risk, and your wealth will grow
I would love to hear from you. If you have any questions or comments or would like to talk about the market, email me at Bonnie@Bonniegortler.com
Disclaimer: Although the information is made with a sincere effort for accuracy, it is not guaranteed that the information provided is a statement of fact. Nor can we guarantee the results of following any of the recommendations made herein. Readers are encouraged to meet with their own advisors to consider the suitability of investments for their own particular situations and for determination of their own risk levels. Past performance does not guarantee any future results
Learn more about Bonnie Gortler at BonnieGortler.com.


