

The double bottom is one of the most popular chart patterns. In most cases, it indicates a change in trend and a momentum reversal from prior leading price action, explains Inna Rosputnia, author, Basic Instinct of Trader.
However, it can be used a trend continuation pattern and deliver good results. In this article you will learn how to trade it with the lowest risk and increase the winning rate. Moreover, I will break down some of the myths about the double bottom.
Double Bottom Pattern Formation
The double bottom looks like the letter "W.” This is because the double bottom pattern has two low formed when the price hits a certain level that can’t be broken. Another essential feature is the neckline. In other words, it is resistance. This double bottom formation is completed when the prices moves back to the neckline after forming the second low. In short, the pattern has four parts to it:
- First low: the market bounces higher and forms a swing low. At this point, it happens because of significant profit-booking.
- Second low: the market rejects the previous swing low (can be a bit above or below the first low). It shows increasing buying pressure.
- Neckline: breakup above resistance (neckline) signals the buyers are in control—the market is likely to move higher.
- The twice-touched low is called a support level.
You could hear that the second low shouldn’t cross the first one. However, it doesn’t really matter. We can get a tradable chart pattern with the second low a bit lower than the previous one. You have to pay attention to other essential studies to trade double bottom successfully.
How to Trade a Double Bottom Chart Pattern?
The double bottom pattern is highly reliable when identified correctly. However, it can be highly detrimental when it is misinterpreted. Most technical analysts say the first bottom should be a drop of 10% to 20%, then the second bottom should form within 3% to 4% of the previous low, and volume on the ensuing advance should increase. However, I follow absolutely different approach. First of all, the market doesn’t reverse because we see the double bottom in the chart. There has to be a fundamental cause for a trend change. So, how and when should we trade the double bottom?
Market reverses if there is a fundamental setup. We can identify it by studying cycles, seasonal forecast, COT (for commodities), insider accumulation, intermarket forecast, government impact (if any), backwardation (for commodities), valuation, etc. If 80% of mentioned studies give a bullish signal, the pattern will most likely play very well, and we can use our strategies to enter the market. On the other hand, if they generate mixed signals, there is a big risk that a double bottom pattern will fail.
Additionally, pay attention to the time and space between the lows—significant “gaps” are more reliable.
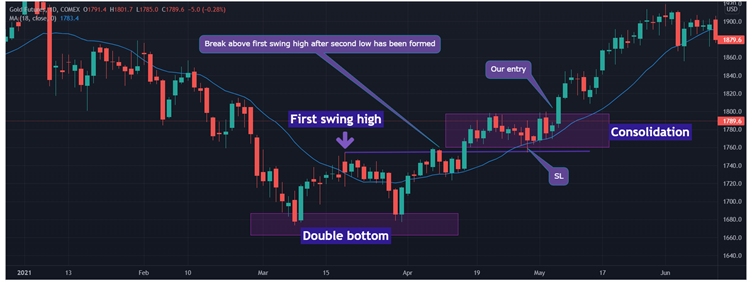
Conservative Entry Technique
Conservative traders should wait for a qualified breakdown of double bottom resistance. What do we call qualified breakout? We have our qualified entry if the price consolidates in a tight range above the previous swing high.
Note, breakup without tight consolidation very often gives false signals. So, we want to stick to qualified entry to filter trades and get the highest winning rate. In this case, the stop loss is the low of the consolidation zone. And the targets can be set by Fibo or Gann levels. Additionally, traders can use 18MA, and engage only if the price trades above the moving average.
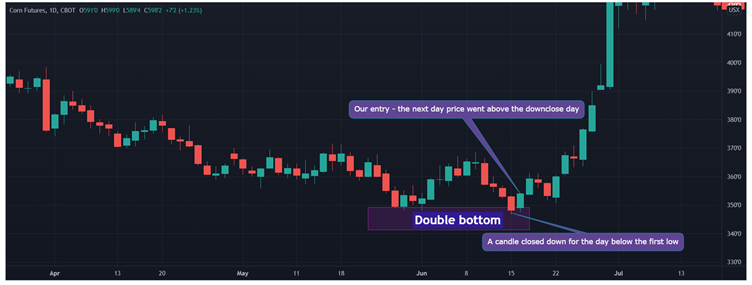
Aggressive Entry Technique
With this technique, you can profit when others are trapped. Let me explain, bearish traders short the market when the price breaks below the first low, but if the price quickly reverses higher, the short traders are “trapped.” So, we can take advantage of it and go long. There are a few rules for this entry:
- First, we need a down close day below the first low.
- Then, if the next day price breaks above the high of the previous day, we can go long.
- Finally, put a stop loss below the swing failure.
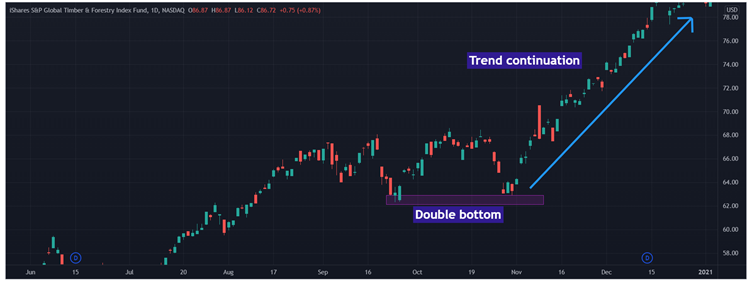
Is Double Bottom a Bullish Reversal Pattern?
Based on all book studies, the double bottom is a reversal pattern. But it is just a myth. And, with twelve years of experience, I can assure you the double bottom is also a great trend continuation pattern. So, why not trade it if it is formed in a strong downtrend? It has a lower risk because you follow the trend. Use mentioned above entries and follow the trend!
Conclusion
To have high winning rate while trading double bottom, follow it when the market is set up for a rally. In other words, when there is a fundamental cause for a trend change. Moreover, trading double bottom as a trend continuation pattern helps to reduce risks.
Learn more about Inna Rosputnia at managed-accounts-ir.com


