
For today’s trade of the day, we will be looking at a Moving Average Convergence/ Divergence (MACD) chart for Amgen, Inc. (AMGN), states Chuck Hughes of TradeWinsDaily.
Before breaking down AMGN’s MACD chart let’s first review what products and services the company offers. Amgen, Inc. discovers, develops, manufactures, and delivers human therapeutics worldwide. It focuses on inflammation, oncology/hematology, bone health, cardiovascular disease, nephrology, and neuroscience areas.
MACD Indicator Confirms Price Momentum
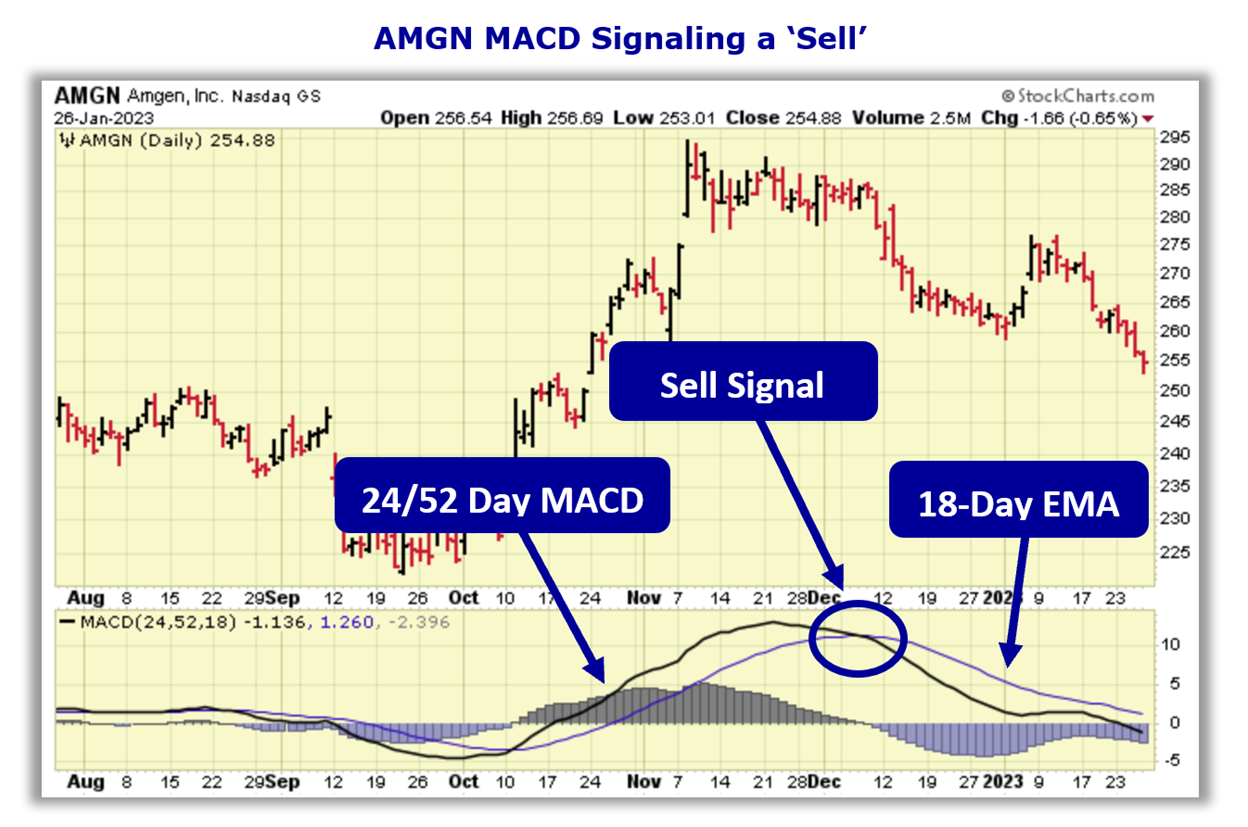
The AMGN daily price chart below shows that AMGN is in a price downtrend as the 24/52 day MACD line (black line) is below the 18-Day EMA (purple line). The Moving Average Convergence/ Divergence chart is shown below the daily price chart.
MACD uses moving averages to create a momentum indicator by subtracting the longer-term moving average from the shorter-term moving average. The MACD is calculated by subtracting a stock’s longer-term 52-Day Exponential Moving Average (EMA) from its shorter-term 24-Day EMA. This creates the MACD line.
MACD ‘Sell’ Signal
The 18-Day EMA line functions as a buy/sell ‘trigger’. When the 24/52 Day MACD line crosses above the 18-Day EMA line it indicates positive momentum and higher prices for the stock. When the 24/52 Day MACD lines cross below the 18-Day EMA it indicates negative momentum and lower prices for the stock. MACD is more of a leading indicator than a moving average cross which tends to lag price movement.
MACD Histogram Shows Acceleration of Momentum
Also included in a MACD chart is the histogram bar graph. This portion of the chart helps to illustrate the distance between the 24/52-Day MACD and the 18-Day EMA. When a crossover initially occurs, the histogram’s bar will be near flat as the two indicator lines have converged. As the lines begin to separate, the bars grow in height, indicating a widening gap and acceleration for the stock’s momentum.
When the histogram’s bars begin to shrink this indicates a narrowing of the gap between the 24/52 Day MACD and the 18-Day EMA and a slowing of the stock’s momentum. When the gap between the two indicators begins to narrow, this typically indicates a crossover of the indicator lines could happen soon.
Sell AMGN Stock
As long as the 24/52 Day MACD line remains below the 18-Day EMA, the stock is more likely to keep trading at new lows in the coming days and weeks. Since AMGN’s bearish run is likely to continue, bearish positions should be initiated. Our initial price target for AMGN stock is 230.00 per share.
159.0% Profit Potential for AMGN Option
Now, since AMGN’s 24/52 Day MACD is trading below the 18-Day EMA this means the stock’s bearish decline will likely continue. Let’s use the Hughes Optioneering calculator to look at the potential returns for an AMGN put option to purchase.
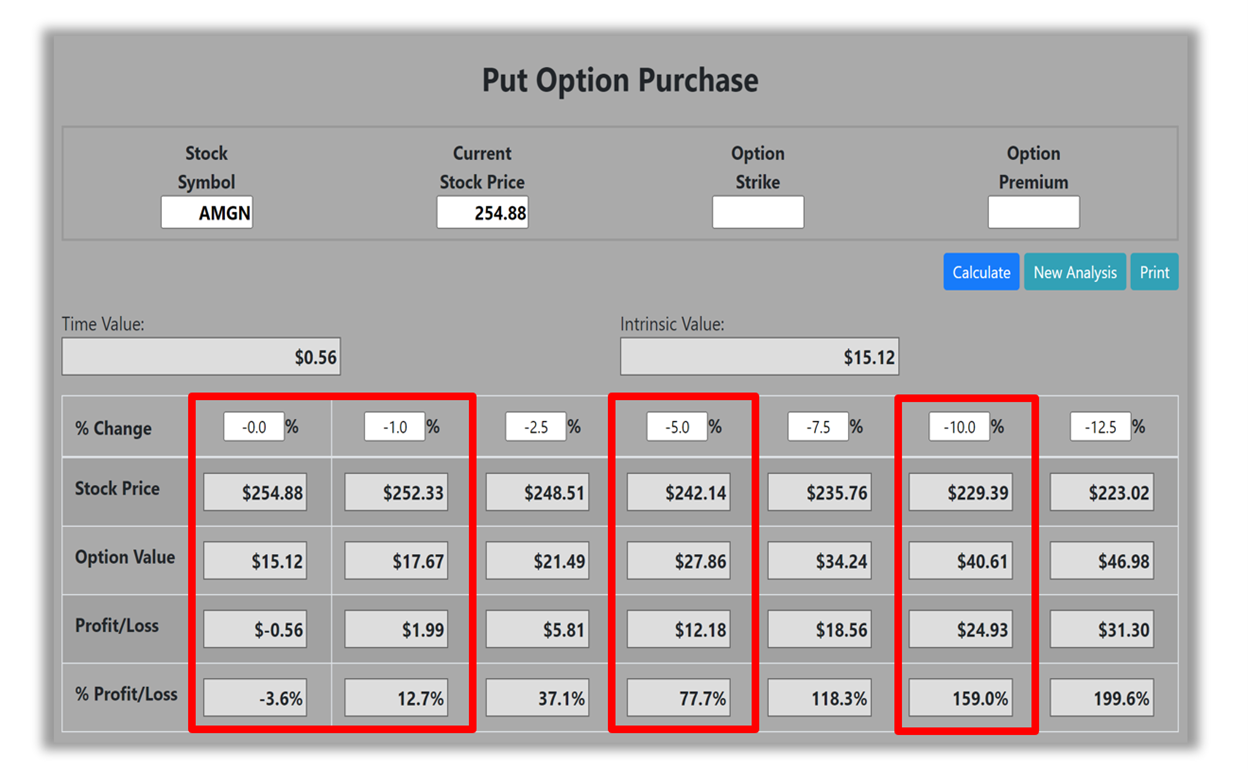
The Put Option Calculator will calculate the profit/loss potential for a put option trade based on the price change of the underlying stock/ETF at option expiration in this example from a flat AMGN price to a 12.5% decrease.
The Optioneering Team uses the 1% Rule to select an option strike price with a higher percentage of winning trades. In the following AMGN option example, we used the 1% Rule to select the AMGN option strike price but out of fairness to our paid option service subscribers we don’t list the strike price used in the profit/loss calculation.
Trade with Higher Accuracy
When you use the 1% Rule to select an AMGN in-the-money option strike price, AMGN stock only has to decrease by 1% for the option to break even and start profiting! Remember, if you purchase an at-the-money or out-of-the-money put option and the underlying stock closes flat at option expiration it will result in a 100% loss for your option trade! In this example, if AMGN stock is flat at 254.88 at option expiration, it will only result in a 3.6% loss for the AMGN option compared to a 100% loss for an at-the-money or out-of-the-money put option.
Using the 1% Rule to select an option strike price can result in a higher percentage of winning trades compared to at-the-money or out-of-the-money put options. This higher accuracy can give you the discipline needed to become a successful option trader and can help avoid 100% losses when trading options.
The goal of this example is to demonstrate the powerful profit potential available from trading options compared to stocks. The prices and returns represented below were calculated based on the current stock and option pricing for AMGN on 1/26/2023 before commissions. When you purchase a put option, there is virtually no limit on the profit potential of the put if the underlying stock continues to decline in price.
For this specific put option, the calculator analysis below reveals if AMGN stock decreases 5.0% at option expiration to 242.14 (circled), the put option would make 77.7% before the commission. If AMGN stock decreases 10.0% at option expiration to 229.39 (circled), the put option would make 159.0% before the commission. The leverage provided by put options allows you to maximize potential returns on bearish stocks.
The Hughes Optioneering Team is here to help you identify profit opportunities just like this one.