

The January advance continued. Nine of eleven S&P SPDR sectors were higher, notes Bonnie Gortler of bonniegortler.com.
Consumer Discretionary (XLY) and Communication Services (XLC) were the leading sectors, while Utilities (XLU), and Healthcare (XLV), were the weakest, with the SPDR S&P 500 ETF Trust (SPY) up +2.48%.
S&P SPDR Sector ETFs Performance Summary 1/20/23 – 1/27/23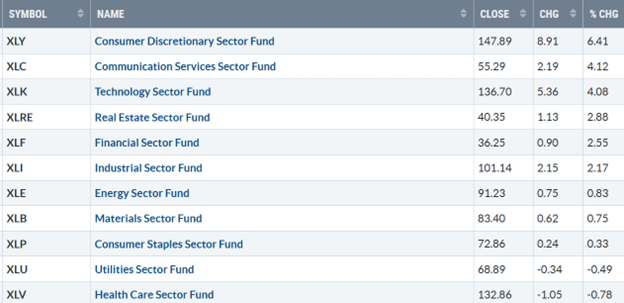
Source: Stockcharts.com
Figure 2: Bonnie's ETFs Watch List Performance 1/20/23 – 1/27/23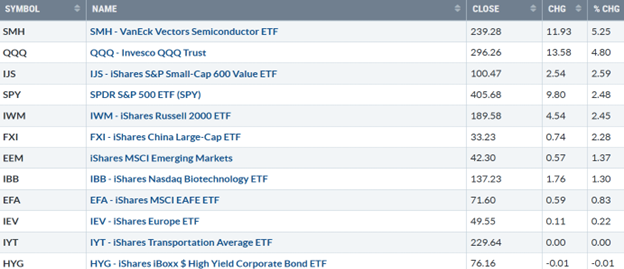
Source: Stockcharts.com
Semiconductors and Technology outperformed. International markets rose but are beginning to show signs a slower pace of the rise may occur. Transports and High Yield Bonds lagged, suggesting caution if they continue to fall.
Figure 3: Fear and Greed Index 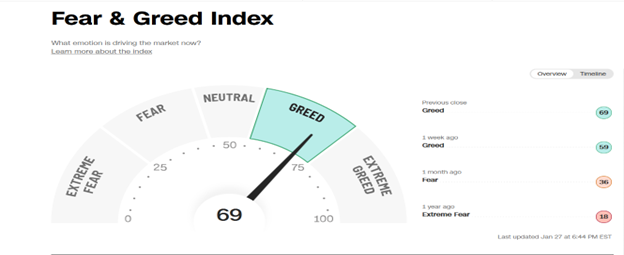
Source: CNN
Investor sentiment based on the Fear and Greed Index (a contrarian Index) rose from 59 to 69 last week, showing greed, and is closer to extreme greed and a potential pullback.
Figure 4: CBOE Volatility Index VIX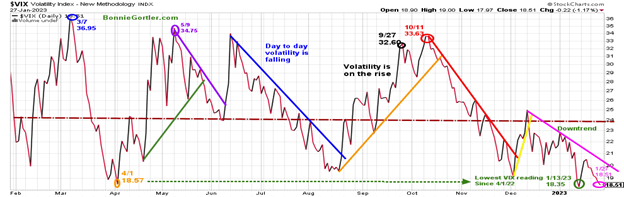
Source: Stockcharts.com
The CBOE Volatility Index (VIX), a measure of fear, traded above 20.00 for most of 2022. In late January 2022, VIX made a high at 36.95 on 3/7 (blue circle) and a low on 4/1/22 at 18.57. A new VIX low didn’t occur until 1/13/23 at 18.35.
Last week, VIX fell, testing the low closing at 18.51 (pink circle). Look for intra-day-day volatility to be contained if VIX remains in the downtrend (green line) and remains below 21.00 next week. The major averages for the week were mixed, Dow was up +1.81%, S&P 500 was up +2.47%, and the Nasdaq was up +4.32%. The Russell 2000 Index rose +2.36%, and the Value Line Arithmetic Index (a mix of approximately 1700 stocks) gained 2.55%.
Weekly market breadth was positive on the New York Stock Exchange Index (NYSE) and slightly negative for Nasdaq. The NYSE had 2406 advances and 906 declines, with 269 new highs and 31 new lows. There were 3306 advances and 1826 declines on the Nasdaq, with 382 new highs and 128 new lows.
Its favorable tape action Nasdaq and New York again had more new highs than lows every day last week.
Watch for New Highs' expanding on the NYSE and Nasdaq for the rally to accelerate higher, or if they fall, implying a pause in the rally in the short term.
Figure 5: Daily New York Stock Exchange (NYSE) New Lows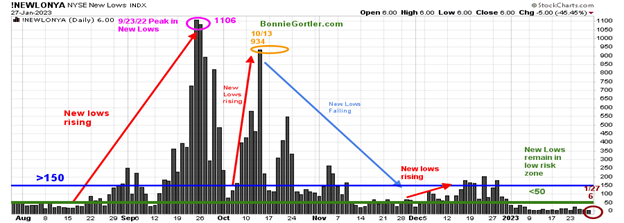
Source: Stockcharts.com
Watching new lows on the New York Stock Exchange is a simple technical tool that helps awareness of the immediate trend's direction. New lows warned of a potential sharp pullback, high volatility, and "panic selling" for most of 2022, closing above 150. The peak reading was 9/23/22 when New Lows made a new high of 1106 (pink circle).
New lows closed on 1/27 at 6 (brown circle), below 25, remaining in the lowest risk zone and short-term positive for the market. On the other hand, a rise above 150 and an expansion of New Lows would be a warning of weakness forthcoming.
Learn more about the significance of new lows in my book, Journey to Wealth, published on Amazon.
Breakout in Small Caps
Figure 6: Daily iShares Russell 2000 (IWM) Price (Top) and 12-26-9 MACD Bottom)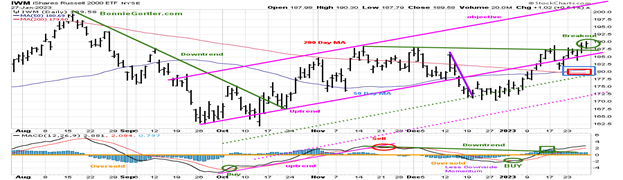
Source: Stockcharts.com
The top chart is the daily iShares Russell 2000 Index ETF (IWM), the benchmark for small-cap stocks, with a 50-Day Moving Average (MA) (blue line) and 200-Day Moving Average (MA) (red line) that traders watch and use to define trends.
IWM closed at 189.58, up +2.45%, closing above its 200-Day MA (red rectangle) and 50-Day MA (blue rectangle) and above the channel where it broke down (pink line) in December, which was acting as resistance.
MACD remains on a buy, above zero (orange line), flattening after breaking the downtrend from November 2022, if IWM turns down, MACD can generate a sell.
Resistance is 192.50, August 22 highs, with support at 187.50, 185.00, and 180.00. The upside channel objective is 202.50, and the downside channel objective is 172.50.
Figure 7: Weekly iShares Russell 2000 (IWM) Price (Top) and 12-26-9 MACD (Bottom)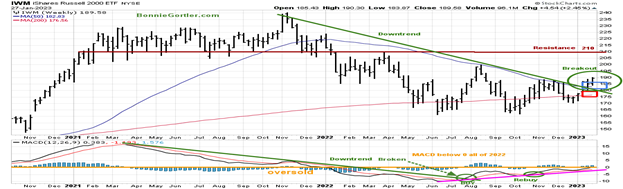
Source: Stockcharts.com
It’s bullish the weekly iShares Russell 2000 Index ETF (IWM) confirmed the daily breakout breaking the weekly downtrend from October 2022 and closing above its 50 and 200 Week Moving Averages. MACD, a measure of momentum, remains on a buy, close to breaking above zero for the first time since 2022, implying underlying strength.
Relative Strength Favors QQQ compared to S&P 500 SPY
Figure 8: Invesco QQQ Trust (QQQ)/SPDR S&P 500 (QQQ/SPY) Weekly Relative Strength Index Ratio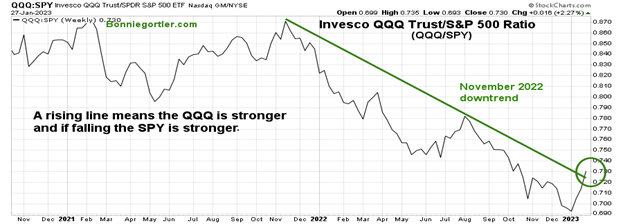
Source: Stockcharts.com
The chart above is the weekly Invesco QQQ Trust (QQQ)/SPDR S&P 500 (SPY) Relative Strength Index Ratio. A rising line means the QQQ is stronger, and if falling, the SPY is stronger.
The (QQQ/SPY) ratio fell to its lowest level at the start of January, turned up, and is, gaining strength, penetrating the November 2022 downtrend (green line). It’s bullish for Information Technology, Communication Services, and Consumer Discretionary stocks, the top sector allocations of QQQ.
Figure 9: Daily Invesco QQQ Trust (QQQ) Price (Top) and 12-26-9 MACD (Bottom) 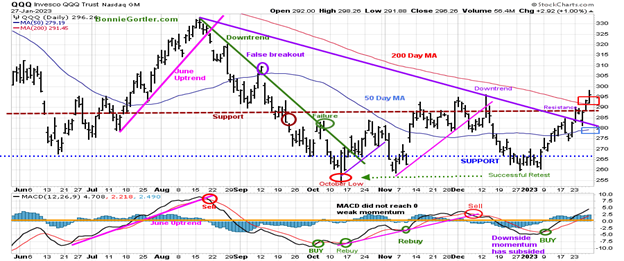
Source: Stockcharts.com
The chart shows the daily Invesco QQQ, an exchange-traded fund based on the Nasdaq 100 Index. QQQ moved lower after a false break out (purple circle) in September of the August downtrend (green line) but had a few rally attempts after but stalled and made a low in October 2022 (red circle). Nasdaq tape action continues to improve in 2023, breaking the downtrend (purple line).
QQQ rose +4.80%% last week, clearly outperforming the S&P 500, closing at 296.26. Its bullish QQQ closed above the 50-Day Moving Average and the 200-Day Moving Average (red rectangle) and resistance at 287.00.
The QQQ held above 275.00 last week and closed above 287.00, breaking the downtrend (purple line) from August 2022. QQQ support is at 291.00, 287.00, and 280.00. The bottom chart is MACD (12, 26, 9) remains on a buy above zero, with positive momentum, its highest reading since last August. Learn about coaching with Bonnie. Ask questions. Discover more about the coaching processes in this 15-minute call by emailing me at Bonnie@BonnieGortler.com. I would love to schedule a call and connect with you.
Figure 10: Nasdaq Composite Index Bullish Percent Index (Top) and Nasdaq Composite Index (Bottom) 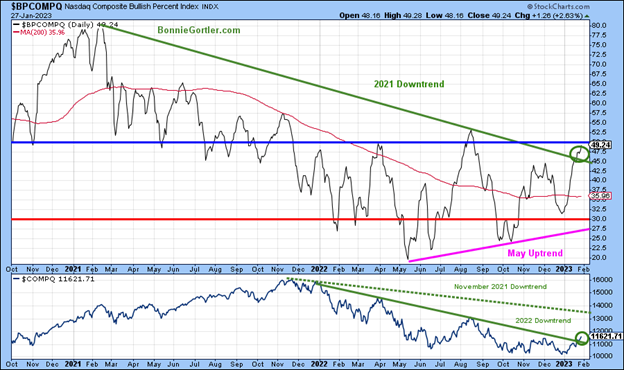
Source: Stockcharts.com
The Nasdaq Composite Index is a market capitalization-weighted index of more than 3,700 stocks listed on the Nasdaq Stock Exchange. The Nasdaq index technical indicators continue to improve.
The Bullish Percentage indicator (BPI) is a breadth indicator. BPI has had higher lows since May 2022 and has formed an uptrend (pink line). With last week's gains, the indicator rose to close at 49.24%, just short of above 50%, which would be a buy signal, but it did break the 2021 downtrend in the BPI, which is positive. The bottom chart is the Nasdaq Composite, with two downtrends (green dotted and solid green line). With the strength last week, the Nasdaq Composite broke the 2022 downtrend (solid green line), which is positive.
Figure 11: Van Eck Vectors Semiconductor (SMH) and 12-26-9 MACD (Bottom) 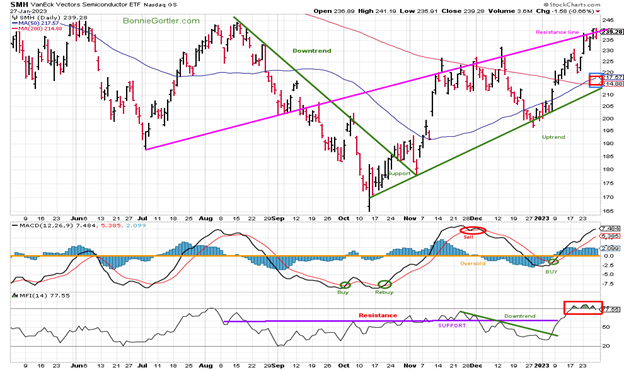
Source: Stockcharts.com
The top part of the chart shows the Van Eck Vectors Semiconductor (SMH) concentrated, mainly in US-based Mega-Cap Semiconductors companies. SMH is a lead indicator for the market when investors are willing to take on increased risk and the opposite when the market is falling.
Semiconductors (SMH) rose sharply,+5.25% last week, and up 17.91% in 2023. SMH has remained in its uptrend since October and remains above its 50 and 200 Day Moving averages (blue and red rectangle) and 50-week and 200-week moving Averages (chart not shown). SMH hit its resistance line (pink) last week, a likely area where to stop rising and begin to consolidate. Support is at 230.00, followed by between 214.00 and 217.00. Resistance is at 245.00.
MACD (lower chart) remains on a buy, rising, showing positive momentum but no longer accelerating higher. SMH hit resistance and turned down on Friday. However, the indicators remain favorable as the uptrend remains in effect, but I would not be surprised if there were a pullback to 230.00 early next week.
S&P 500 Trend daily trend is up after breaking the 2022 downtrend
Figure 12: The S&P 500 Index ($SPX) Daily (Top) and 12-26-9 MACD (Bottom)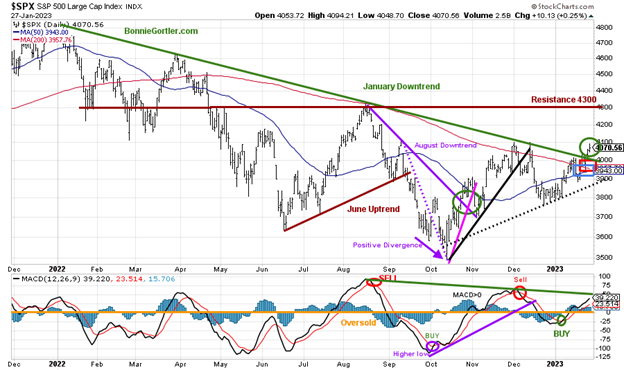
Source: Stockcharts.com
The S&P 500 (SPX) failed to get through resistance at 4100 in December 2022 and reversed lower, breaking the October uptrend (black line). The S&P 500 broke the 2022 downtrend (green line/circle) last week, and the daily trend is up. The S&P gained +2.47%, closing at 4070.56, above its 50-and 200-Day Moving Average (blue and red rectangle), showing underlying strength.
Resistance is at 4300, while support is at 4000, 3900, and 3800. MACD (lower chart) remains on a buy (green circle) from below zero, is rising, and is close to breaking its downtrend, implying the worst downside momentum is complete. Watch if SPX can close above 4100 and gain momentum towards 4300 or if the SPX stalls and generates a MACD sell.
Figure 13: The S&P 500 Index ($SPX) Weekly (Top) and 12-26-9 MACD (Bottom)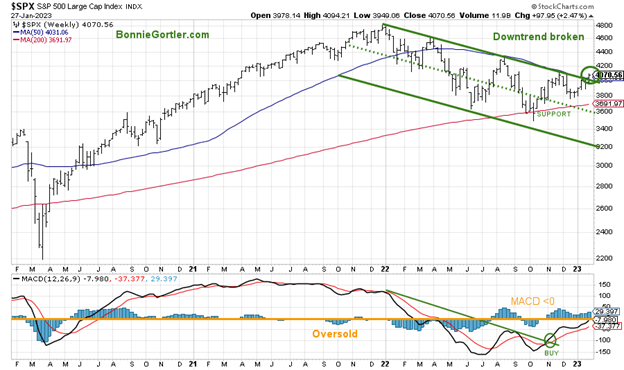
Source: Stockcharts.com
The top chart shows the weekly S&P 500 Index breaking the weekly downtrend and shifting the intermediate trend to up. MACD (lower chart) is on a buy and broke the 2022 downtrend in November 2021 and continues to rise, close to reaching zero, implying a sign of strength.
S&P 500 has broken out to the upside, with an upside target of 4400 and potentially higher. However, 3600 remains a crucial support area (green dotted line) for the intermediate term, the mid-channel (green dotted line), or expect a leg down towards the lower channel at 3200.
U.S. Dollar remains in a downtrend
Figure 14: U.S. Dollar Daily 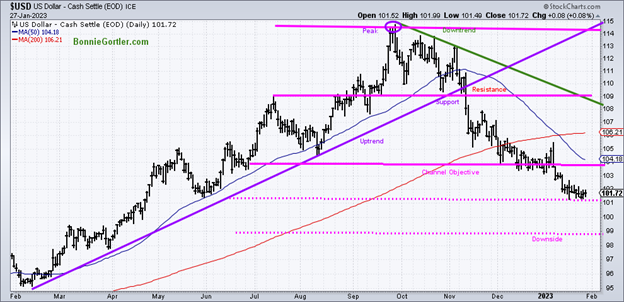
Source: Stockcharts.com
The U.S. dollar peaked in September 2022, starting a downtrend that remains in effect. The U.S. dollar fell slightly by -0.06% and closed near the bottom of the range for the week, supporting the international and U.S. markets.
The downside objective remains at 98.80 (pink dotted line), and a close above 104.00 would negate the downside objective. The dollar appears to have stabilized during the last two weeks with no up or downside pressure ahead of the FOMC meeting next week, despite breaking the weekly uptrend from June 2021 (chart not shown). The continued weakness of the U.S. dollar bodes well for global and U.S. equities in the coming weeks. However, if the dollar rises, look for a short-term pullback in the U.S. and international markets.
Figure 15: Vanguard FTSE All-Word ex-US ETF Weekly and 12-26-9 MACD (Bottom)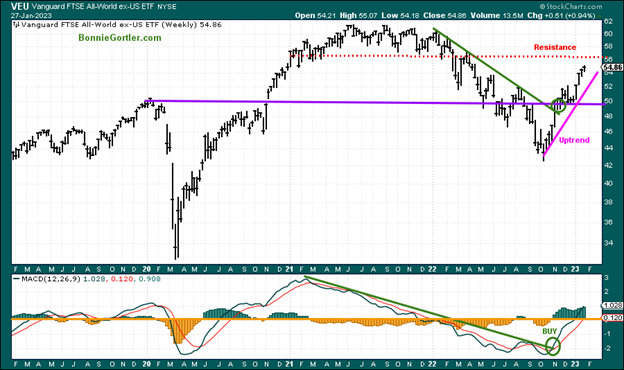
Source: Stockcharts.com
The top chart is the Vanguard FTSE All-World ex-US ETF Weekly chart going back to 2019. VEU includes approximately 2,200 stocks of companies located in 46 countries, including developed and emerging markets worldwide.
VEU broke its downtrend in November 2022 (green circle) and continues higher, VEU rose 0.94% for the week, underperforming the S&P 500. MACD remains on its November buy (green line), rising above zero and at its highest reading since July 2021. Resistance is at 56.00 and 58.00, and support is at 52.00 and 50.00. It will not be a good sign if VEU has a weekly close below 52.00 which would break the uptrend.
Follow up on XOP from the Market Update 1/13/23 Speculative Buying Opportunity – Positive Divergence Confirmed by a MACD buy
Figure 16: SPDR Oil and Gas Exploration (XOP) and 12-26-9 MACD (Bottom)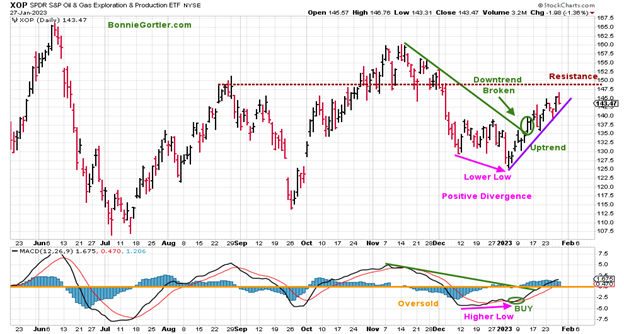
Source: Stockcharts.com
The XOP ETF provides exposure to US companies in oil and gas exploration & production space and rebalances quarterly. Two weeks ago, a buying opportunity developed in SPDR Oil and Gas Exploration (XOP). It's positive that the November 2021 downtrend broke (green line), combined with a MACD buy (green circle lower chart) from an oversold condition and positive divergence, one of my favorite buying patterns.
XOP was volatile on Friday, making a high at 146.76 but closing at 143.47, near its low, not a good sign for next week. However, XOP remains in an uptrend with further gains possible. Resistance is at 148.00, and support is at 140.00. A close below 140.00 would break the uptrend and likely give a sell on MACD. Close all positions if there is a close below 140.00.
Summing Up:
The major averages all rose, adding to the gains in 2023. Tape action remains positive, with downtrends broken in Nasdaq, S&P 500, and Russell 2000. Nasdaq had its fourth positive week in a row and best month since July. Earnings season continues this week, including Amazon, Apple, Meta, Advanced Micro Devices, Qualcomm, Google, Exxon, and more, which are likely to add to the daily volatility. Profit-taking appeared to start with a weak close on Friday after hitting overhead resistance above. Investors may be cautious ahead of earnings and the FOMC meeting this week. With the January thrust to the upside and improvement in market breadth in 2023, any pullback is likely to be temporary, with higher prices ahead.
Remember to manage your risk, and your wealth will grow.
Let’s talk investing. You are invited to set up your Free 30-minute Wealth and Well-Being Strategy session by emailing me at Bonnie@BonnieGortler.com. I would love to schedule a call and connect with you.
Disclaimer: Although the information is made with a sincere effort for accuracy, it is not guaranteed that the information provided is a statement of fact. Nor can we guarantee the results of following any of the recommendations made herein. Readers are encouraged to meet with their own advisors to consider the suitability of investments for their own particular situations and for determination of their own risk levels. Past performance does not guarantee any future results.


