

The USD/JPY is our featured currency pair. We saw some interesting price action last week, suggesting the pair may have resumed its bearish trend again, writes Fawad Razaqzada, technical analyst at Trading Candles.
Plus, the narrowing of the spread between US and Japanese bond yields point to a lower USD/JPY exchange rate. Markets are trading in a subdued fashion, though, lacking fresh impetus from the US economic calendar – and instead leaning into broader macro themes.
As far as the USD/JPY forecast is concerned, and with finance chiefs from the US and Japan expected to touch on currency matters, there’s a touch of caution in the air. Japanese policymakers may use the opportunity to raise concerns over excessive yen weakness.
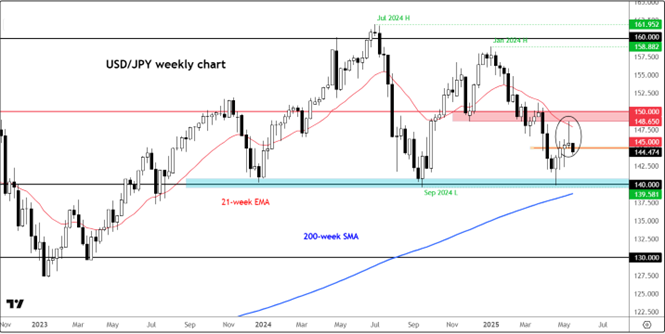
Yet the long-term bullish trend on weekly and higher time frames of the USD/JPY ended in July 2024 when rates repeatedly failed to hold breakouts above the 160.00 handle. Since then, we have seen at least two periods of extended declines: Once last summer when the unwinding of the carry trade was the theme, and once at the start of this year, when trade war concerns boosted the appeal of the haven yen.
Looking at the weekly chart of the USD/JPY, one can observe that an inverted hammer candle was formed last week when rates tested – and reversed from – the bottom range of a key resistance zone between 148.65 to 150.00. This area is shaded in red on the chart. The fact that resistance held here suggests that the bearish trend that began last summer may have now resumed.


