

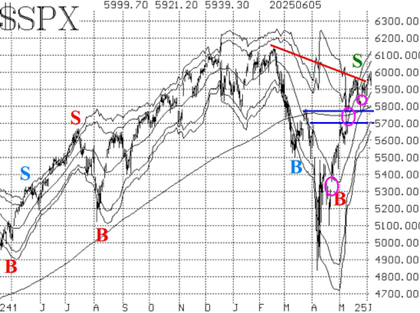
The downtrend line connecting the February and May highs in the S&P 500 Index (^SPX) was a major impediment on the upside, but now SPX has overcome that. A strong reaction to the unemployment report last Friday led it to trade to new, relative highs. If it can hold this level, new absolute highs should be the next stop, highlights Lawrence McMillan, editor at Option Strategist.
Those all-time highs are at 6,150, so that is resistance for now. There should be support just above 5,900, and at the next two gaps (5,840 and 5,700). A move below 5,700 would be very bearish, but I don't expect to see that in the near term.
Despite the improvement in the SPX chart, there are still some mixed signals amongst our indicators. On the positive side of the ledger, the equity-only put-call ratios continue to decline. Thus, they remain on buy signals for the stock market.
But market breadth has not been able to expand. The NYSE-based breadth oscillator has steadfastly remained on a sell signal for a while, although the “stocks only” oscillator did move above +200 for two days before falling back again.
The CBOE Volatility Index (^VIX) itself has continued to decline, and that is perhaps having some important consequences. First of all, the “spike peak” buy signal of May 23 remains intact. That buy signal will remain in effect for 22 trading days, unless stopped out by VIX re-entering “spiking mode.”
Overall, things continue to improve, as a majority of our indicators – but not all – are bullish. A move above 6,150 would be very positive. In any case, we will trade individual signals as they occur, and we will continue to roll deeply in-the-money options.


