

The Federal Reserve lowered rates by a quarter of a percent last Wednesday, and the market liked it. Many people had been expecting a “sell on the news” after that, but instead the S&P 500 Index (^SPX) plowed ahead to new all-time highs in a strong fashion. The SPX chart remains very bullish, notes Lawrence McMillan, editor at Option Strategist.
There is support at 6,500 (the August highs), 6,340-6,360 (the August lows), and 6,200 (the July lows). Those are all marked with horizontal red lines on the chart here.
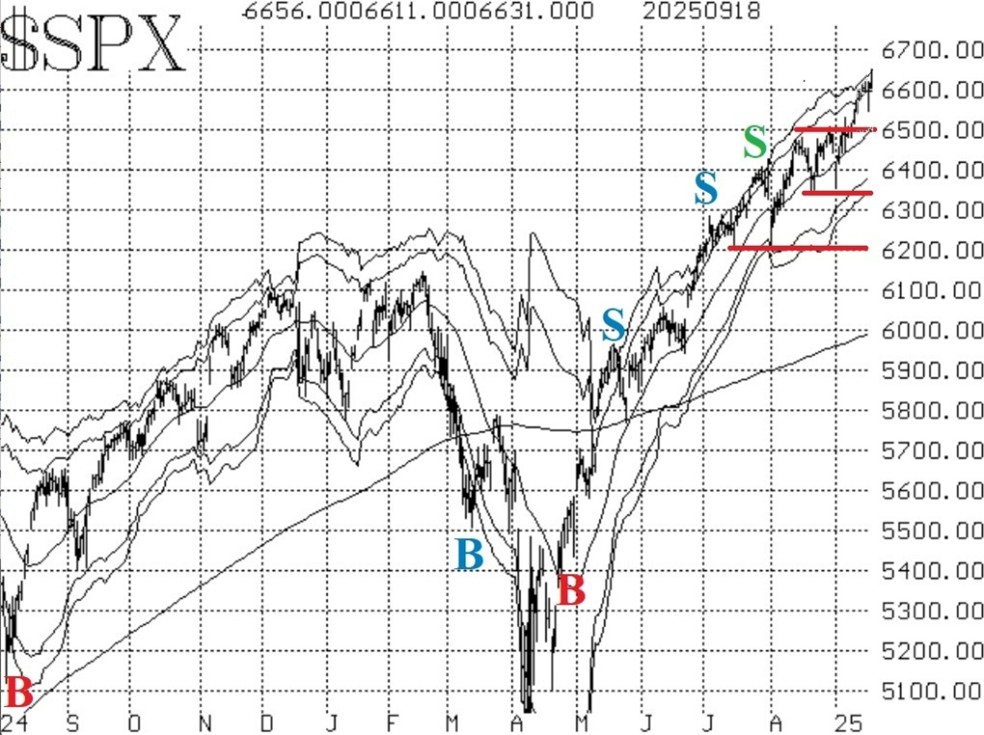
Any move below 6,500 would be disappointing now that SPX has made its move higher. But even if that occurred it would not necessarily disturb the bullish pattern of the SPX chart.
Breadth has been poor, for the most part, although it was strong on Sept. 18. That is enough to keep the breadth oscillator signals in doubt. Prior to that, those oscillators had been ready to generate new sell signals, but that is not the case now.
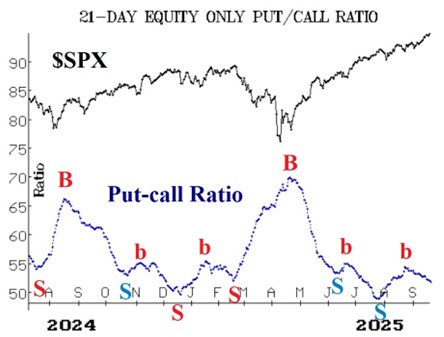
Meanwhile, equity-only put-call ratios continue to be bullish for stocks, as they are still dropping. They will remain in this bullish mode until they roll over and begin to rise.
We continue to view the market positively, mostly because of the strong SPX chart, but also because of the number of bullish indicators still in place. We will take any new signals that arise, and we most certainly continue to encourage rolling deeply in-the-money calls up to higher strikes.


