

I’m always on the lookout for “Sleeper Sectors” – groups of stocks that may not be getting talked about much, but that might have a surprise catalyst brewing. Today, let’s look at homebuilders!
This is my first MoneyShow Chart of the Day, which shows the average rate on a 30-year fixed mortgage going back three years. As you can see, we’re getting close to breaking the 6% threshold to the downside. We’re also right around a three-year low.
Chart #1: 30-Year Mortgage Rates
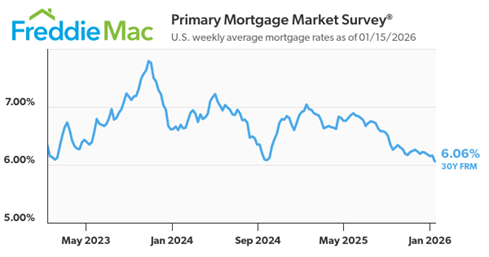
Source: Freddie Mac
Now here’s my second MoneyShow Chart of the Day, which shows a much longer-term chart of existing home sales. You can see the huge dip during the pandemic, the big rebound afterward, the sickening slump that followed...and the long period of sideways chop since 2023.
Chart #2: Existing Home Sales
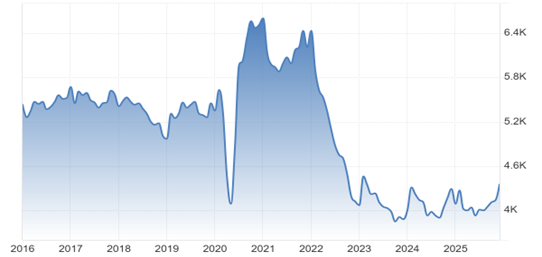
Source: Trading Economics
If you look closely at the last few months, though, you can also see that we’ve seen a persistent pickup in sales. Falling financing costs, solid-if-not-spectacular wage growth, and price stagnation in many parts of the country is helping restore a semblance of affordability to homes again. And buyers are starting to notice.
As for homebuilding STOCKS? Well, the State Street SPDR S&P Homebuilders ETF (XHB) is up in the past year...but only 7.3%. The iShares US Home Construction ETF (ITB) is up just 4.2%. Both are badly lagging the 19.9% rise in the SPDR S&P 500 ETF Trust (SPY) during the same 12-month period.
XHB also owns building supply companies, home furnishing retailers, home improvement stores, and other derivative stocks. So, it’s not technically a “pure-play” home builder ETF. But ITB is much more heavily weighted toward builders like DR Horton Inc. (DHI) and Lennar Corp. (LEN)…and even it hasn’t moved much.
So, I think the Sleeper Sector name applies here. And I think you may want to investigate these stocks and funds further for 2026.


