

Charts are taking a backseat to geopolitics. Right now, oil prices and developments in the Middle East are the dominant forces driving markets. But from a technical standpoint, S&P 500 futures still show a bearish structure, writes Fawad Razaqzada, technical analyst at TradingCandles.
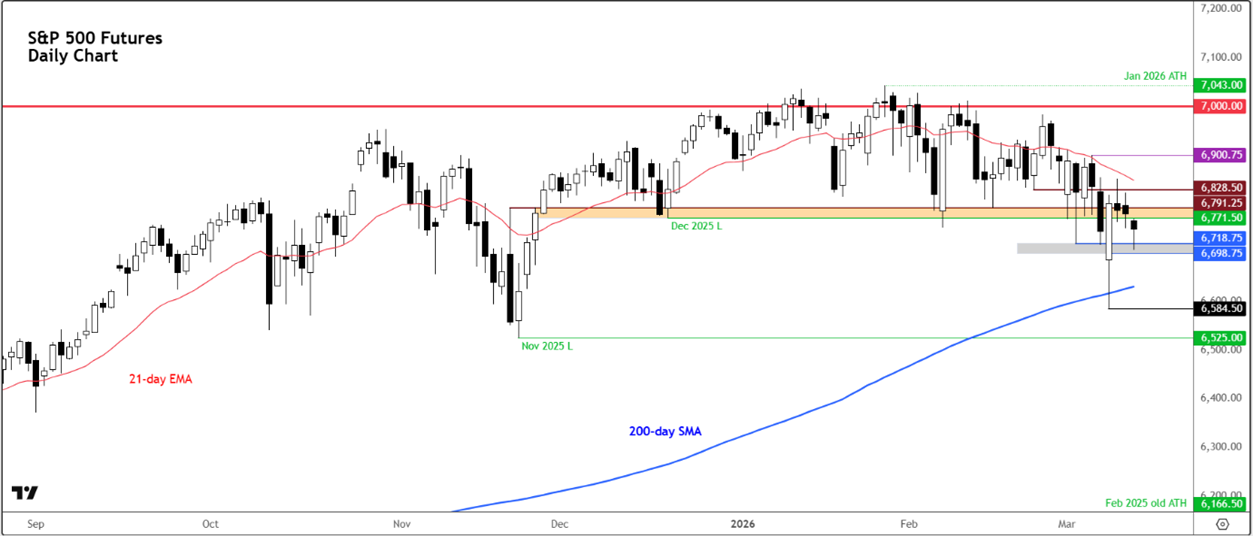
The index is forming lower highs and lower lows since peaking near the 7,000 level. That pattern suggests the market is still favouring breaks of support rather than resistance. The key resistance zone sits between 6,771 and 6,791, an area that previously acted as strong support before breaking lower late last week.
Monday saw the index gap lower before staging a strong rebound, eventually closing in positive territory. However, the rally failed to generate any meaningful follow-through in subsequent sessions — a pattern seen across global markets since the conflict began.
In other words, rallies are appearing sharp but short-lived. That raises the risk that bullish traders are being caught in temporary squeezes. If selling pressure returns, the index could drift back toward Monday’s low at 6,584, where many dip buyers are likely to have placed stop orders.
Before that, the first key support sits between 6,698 and 6,718. A break below this zone could open the door for renewed downside momentum. Beyond that, the next notable level comes in around the November low near 6,525.
On the upside, bulls would first need to reclaim the 6,771–6,791 resistance zone on a daily closing basis to stabilize the near-term outlook. A stronger technical recovery would require a break above the recent consolidation highs near 6,900, as well as a move back above the 21-day exponential moving average.
Until then, the technical picture remains fragile.


