

Last week, the S&P 500 Index (^SPX) hit an all-time high, led by mega-caps, which are heavily weighted in the index. But the technical picture shows market internals weakening. That makes sense given the strong run-up since March, writes Bonnie Gortler, CEO of BonnieGortler.com.
While the primary trend remains positive, market conditions are becoming more selective. On March 27, new lows peaked at 219 on the New York Stock Exchange Index, then immediately contracted in early April. In May, new lows are rising again, recently closing at 108. If new lows continue to rise above 150 and remain, it would be a short-term negative.
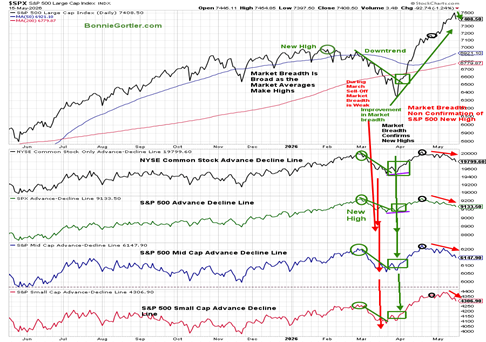
While the S&P 500 made a new high, it was with unconfirmed market breadth – as measured by the Advance-Decline line of the NYSE Common Stock Index, the S&P 500, and the S&P Mid and Small Cap Indices (arrows in red). Keep a close eye on market breadth. A turn up would be positive; continued weakness would be negative in the short term.
It also bears watching that longer-term bond yields rose sharply on Friday amid concerns about inflation, rising oil prices, and a growing annual deficit. Heavy selling occurred across the US market, gold, silver, emerging markets, and other global markets.
Price trends of the major averages remain in daily and weekly uptrends, with semiconductors and technology leading the market higher. But if they decline and are no longer leaders, and longer-term yields continue to rise, the risk of a more serious pullback could increase rapidly.


